


The crypto market is trading with a cautious, headline-driven tone heading into November 2026, as traders weigh the stalled CLARITY Act vote in the US Senate against a broad move out of risk assets. Bitcoin has fallen to near $73,500 in November, while several large-cap altcoins, including XRP, Solana and Ethereum, have given back the whole of the late-August rally. Institutional flows and regulatory clarity continue to shape which large-cap tokens hold up best, keeping investor interest concentrated in coins with strong financial health and proven real-world utility.
This blog breaks down the top 10 crypto assets by market capitalization in November 2026, what each project does and what its daily chart currently shows. Every one of the ten fell over the past week, so the figures below are read in that context.
Top 10 Cryptos as per Market Cap
| Name | Price | Market Cap |
|---|---|---|
| Bitcoin (BTC) | $73,468.27 | $1.47T |
| Ethereum (ETH) | $2,055.28 | $251.17B |
| Tether (USDT) | $0.9990 | $175.78B |
| BNB (BNB) | $679.91 | $89.41B |
| USDC (USDC) | $0.9997 | $69.78B |
| XRP | $1.06 | $67.33B |
| Solana (SOL) | $83.86 | $49.59B |
| Tron (TRX) | $0.3164 | $30.06B |
| Hyperliquid (HYPE) | $72.54 | $18.35B |
| Zcash (ZEC) | $973.28 | $16.5B |
The table was updated on 11 November 2026. Prices and market capitalisations sourced from CoinMarketCap.
1. Bitcoin (BTC)
Bitcoin is the largest crypto asset by market capitalization and the one most portfolios are built around, with the deepest liquidity and the longest record of any token on this list. It has given up the whole of its October range over the past month.
Bitcoin Price Chart. Source: TradingView
| Metric | Data |
|---|---|
| Current Price | $73,468.27 |
| Market Capitalization | $1.47T |
| Circulating Supply | 20.11M BTC |
| Max Supply | 21,000,000 BTC |
| 24h Volume | $27.24B |
| 2026 YTD Change | -15.9% |
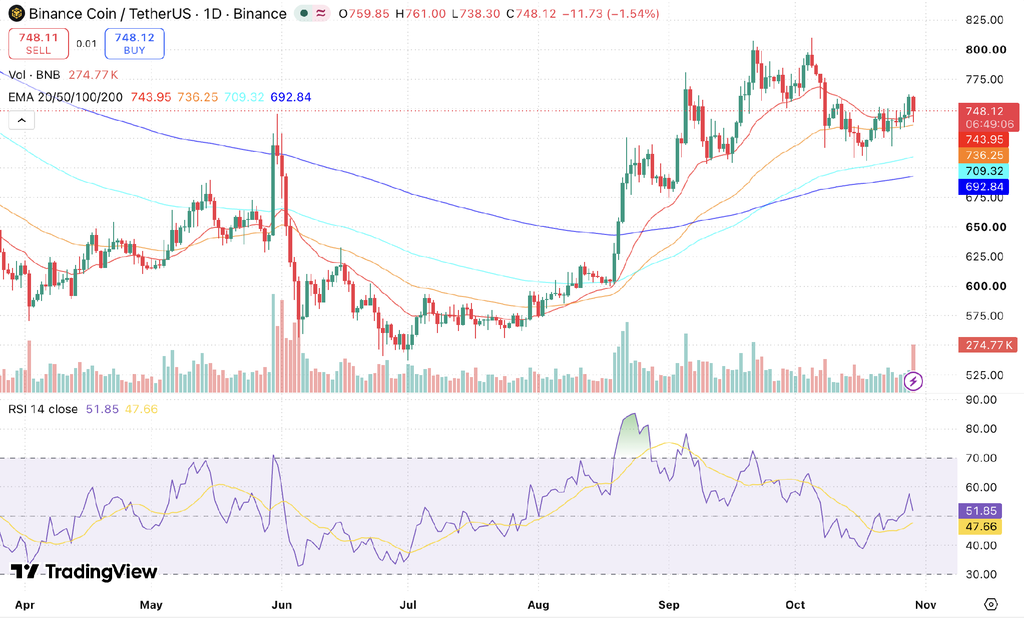
Key Insights: Bitcoin trades at $73,618 on the chart, below all four of its key moving averages: the 200-day EMA at $76,418, the 100-day at $77,483, the 20-day at $77,678 and the 50-day at $79,011. RSI at 34.03 against a signal of 38.53 sits well under the neutral midpoint of 50. The 200-day average is the nearest of the four, which makes it the level the chart is measured against from here.
Why Consider Bitcoin: Bitcoin turned over $27.24 billion in 24 hours against a $1.47 trillion market capitalisation, by far the deepest market on this list, which means large orders can be filled without moving the price. Its supply is capped at 21 million and 20.11 million are already issued, so almost all of the eventual supply exists. It is down 15.9% over 2026, the second-mildest fall among the eight non-stablecoins here.
Read more: Bitcoin Price Prediction
2. Ethereum (ETH)
Ethereum is the second-largest token and the chain with the most smart contracts and tokens are built on. It was designed to do more than move value between wallets, letting developers run programs directly on the network.
Ethereum Price Chart. Source: TradingView
| Metric | Data |
|---|---|
| Current Price | $2,055.28 |
| Market Capitalization | $251.17B |
| Circulating Supply | 122.2M ETH |
| Max Supply | n/a |
| 24h Volume | $11.4B |
| 2026 YTD Change | -31.0% |
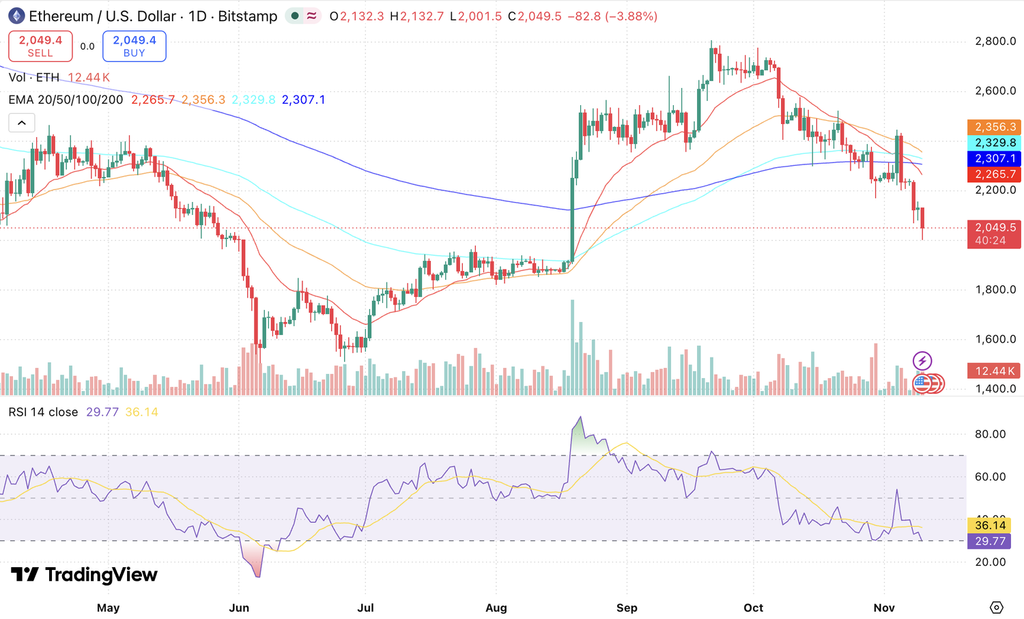
Key Insights: Ethereum trades at $2,049.5, below all four key averages: the 200-day EMA at $2,307.1, the 100-day at $2,329.8, the 20-day at $2,265.7 and the 50-day at $2,356.3. RSI at 29.77 against a signal of 36.14 has dropped under the 30 line conventionally read as oversold, the third-lowest reading on this list. The chart shows a fall of 15.6% over the past week.
Why Consider Ethereum: Ethereum has no supply cap, so new tokens are issued continuously, though a fee-burning mechanism removes some of them from circulation. Daily turnover of $11.4 billion against a $251.17 billion market capitalization is a ratio above 4.5%, which is ample depth for orders of ordinary size. It is down 31.0% over 2026.
Read more: Ethereum Price Prediction
3. Tether (USDT)
Tether is a stablecoin, which means it is designed to hold a fixed value of one US dollar rather than to rise or fall. It is used mainly as a place to hold value between trades and as the pricing unit for most crypto pairs, including on CoinDCX.
Tether Price Chart. Source: TradingView
| Metric | Data |
|---|---|
| Current Price | $0.9990 |
| Market Capitalization | $175.78B |
| Circulating Supply | 175.95B USDT |
| Max Supply | n/a |
| 24h Volume | $56.91B |
| 2026 YTD Change | 0.0% |
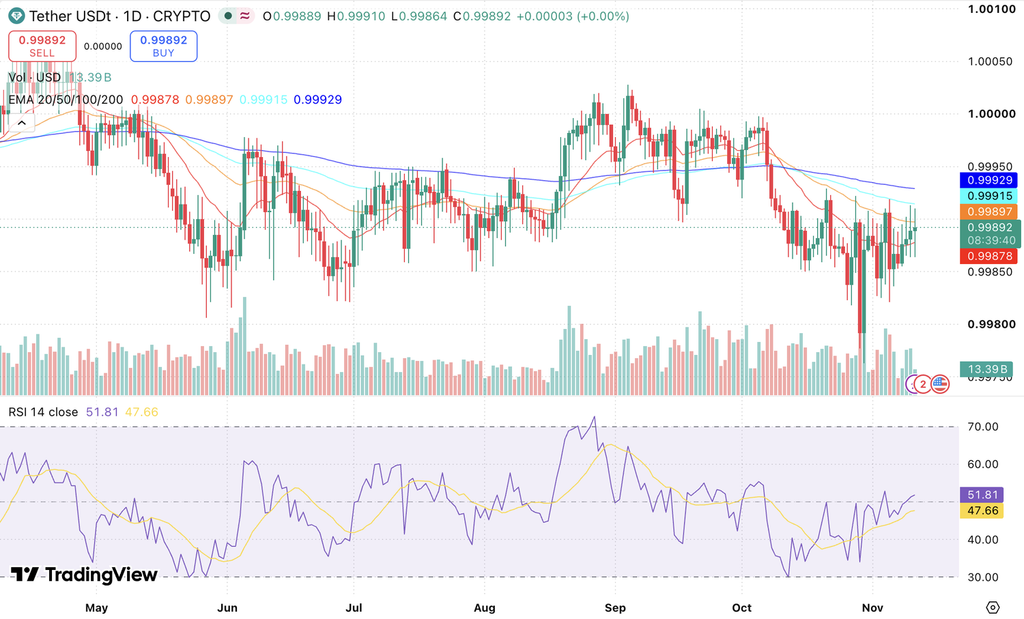
Key Insights: USDT trades at $0.99892, about 0.11% under its dollar peg. It sits above its 20-day EMA at $0.99878 and below the 50-day at $0.99897, the 100-day at $0.99915 and the 200-day at $0.99929, though the entire spread between the four averages is five hundredths of one per cent. RSI at 51.81 against a signal of 47.66 is near neutral. For a stablecoin these readings describe the size of the peg deviation rather than a trend.
Why Consider Tether: USDT is not held in the hope that it rises. Its $56.91 billion of daily volume is the highest on this list and more than double Bitcoin’s, because it is the unit most other tokens are traded against. The risk with a stablecoin is not price movement but whether the issuer holds the reserves it claims, which is why reserve reporting matters more than any chart here.
4. BNB (BNB)
BNB is the native token of the BNB Chain, where it pays transaction fees and is used across the applications built on that network. It is the fourth-largest crypto asset by market capitalization.
BNB Price Chart. Source: TradingView
| Metric | Data |
|---|---|
| Current Price | $679.91 |
| Market Capitalization | $89.41B |
| Circulating Supply | 131.51M BNB |
| Max Supply | n/a |
| 24h Volume | $1.23B |
| 2026 YTD Change | -21.2% |
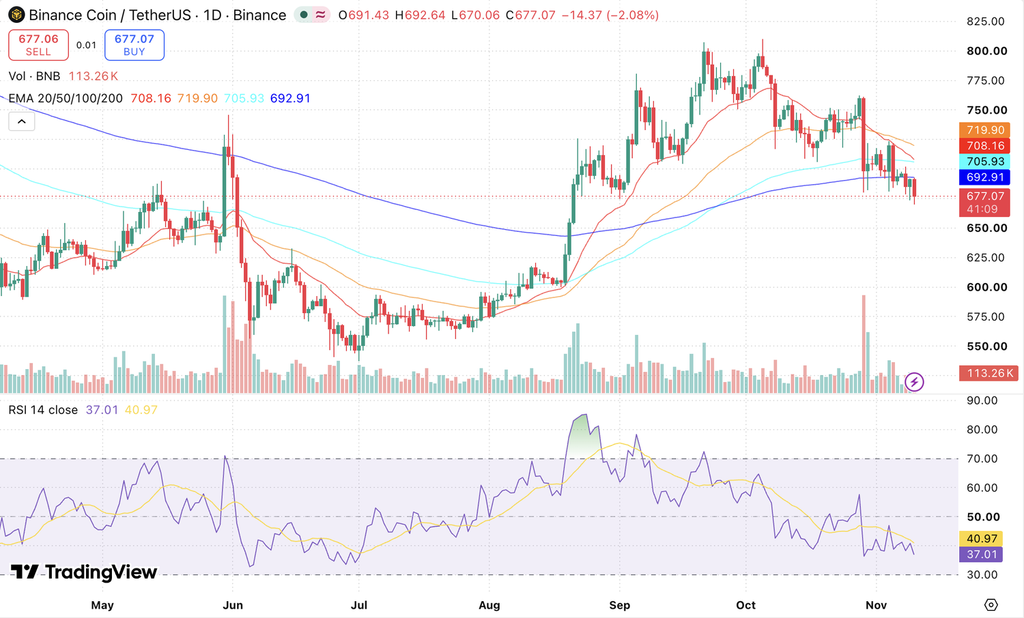
Key Insights: BNB trades at $677.07, below all four key averages: the 200-day EMA at $692.91, the 100-day at $705.93, the 20-day at $708.16 and the 50-day at $719.90. The four sit within about $27 of one another, so the whole cluster is close overhead rather than far above. RSI at 37.01 against a signal of 40.97 is below neutral and below its own signal line.
Why Consider BNB: BNB’s supply falls over time through a quarterly burn programme, which removes tokens from circulation permanently. Daily turnover of $1.23 billion against an $89.41 billion market capitalization is a ratio near 1.4%, the thinnest of the eight non-stablecoins here, so BNB trades less actively relative to its size than the rest of this list.
5. USDC (USDC)
USDC is the other large stablecoin on this list, also pegged to one US dollar. Like Tether it is used for holding value between trades rather than for price appreciation, and it has moved above XRP into fifth place by market capitalization.
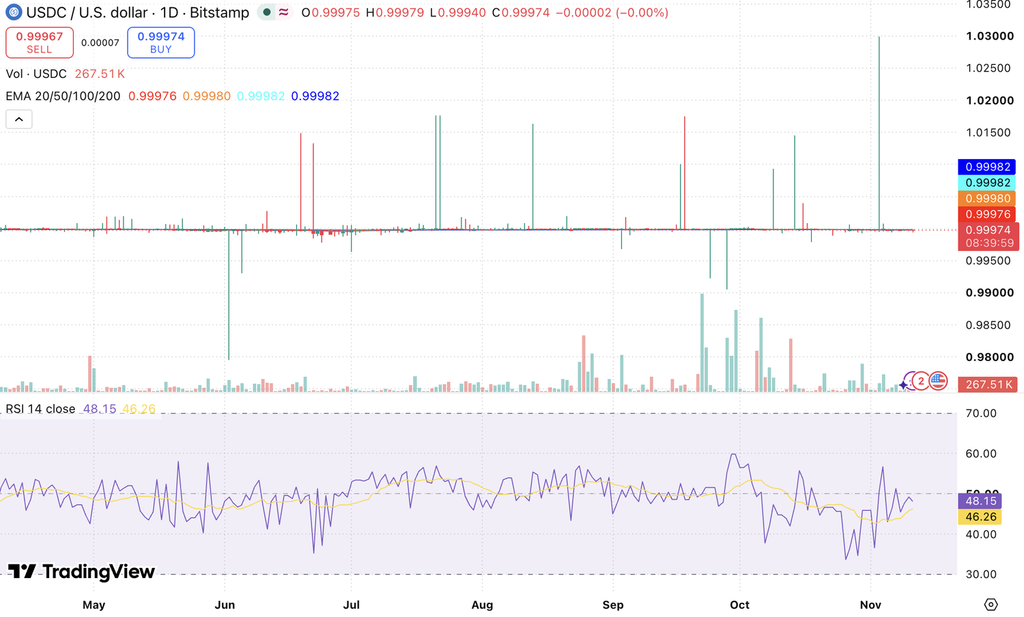
USDC Price Chart. Source: TradingView
| Metric | Data |
|---|---|
| Current Price | $0.9997 |
| Market Capitalization | $69.78B |
| Circulating Supply | 69.79B USDC |
| Max Supply | n/a |
| 24h Volume | $11.14B |
| 2026 YTD Change | -0.1% |
Key Insights: USDC holds its peg more tightly than Tether, trading at $0.99974, about 0.03% under one dollar. Its four EMAs sit at $0.99976, $0.99980, $0.99982 and $0.99982 for the 20, 50, 100 and 200-day, a total spread of six millionths of a dollar. RSI at 48.15 against a signal of 46.26 is effectively neutral. None of these readings describes a trend; they describe how closely the peg has held.
Why Consider USDC: USDC turned over $11.14 billion in 24 hours against a $69.78 billion market capitalization, a ratio near 16%, which is high because it is used as a settlement asset rather than as a holding. As with Tether, the thing to check is reserve quality and issuer disclosure rather than the price chart.
6. XRP
Ripple-backed XRP is used for cross-border transfers, where it is intended to settle payments between currencies faster and more cheaply than traditional banking rails. It has slipped from fifth to sixth place by market capitalization.
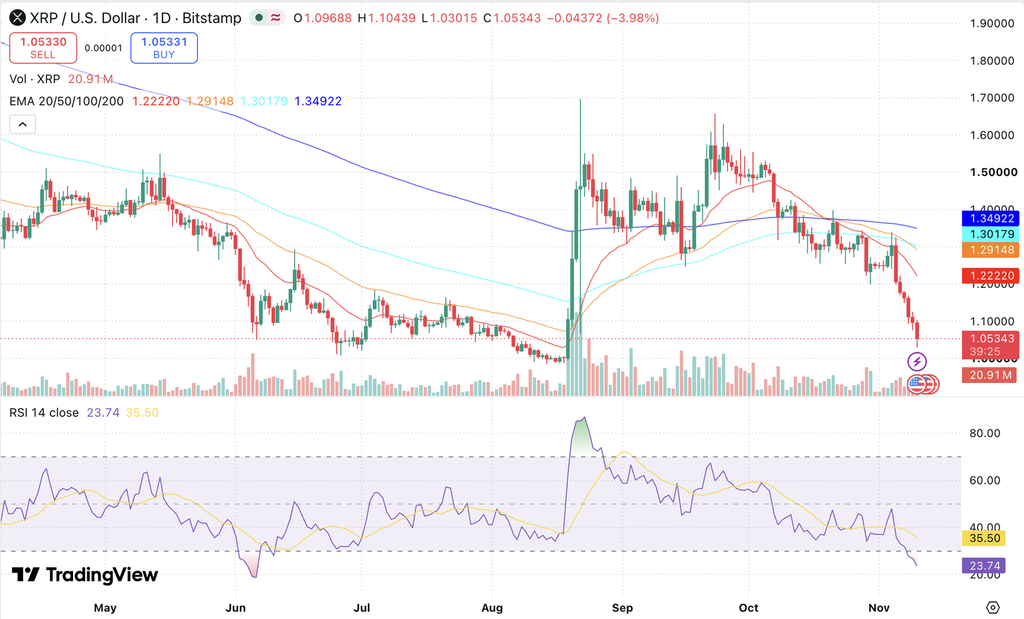
XRP Price Chart. Source: TradingView
| Metric | Data |
|---|---|
| Current Price | $1.06 |
| Market Capitalization | $67.33B |
| Circulating Supply | 63.51B XRP |
| Max Supply | 100,000,000,000 XRP |
| 24h Volume | $2.21B |
| 2026 YTD Change | -42.5% |
Key Insights: XRP has the weakest chart structure on this list. Price at $1.05343 sits below all four key averages, which are stacked in order from shortest to longest at $1.22220, $1.29148, $1.30179 and $1.34922. That ordering is what an uninterrupted decline produces. RSI at 23.74 against a signal of 35.50 is the lowest reading of the ten and well inside oversold territory.
Why Consider XRP: XRP’s supply is capped at 100 billion and 63.51 billion are in circulation, so roughly 36% has yet to reach the market, which is the largest undistributed share on this list. It is down 42.5% over 2026 and fell 20.6% in the past week alone. Daily turnover of $2.21 billion against a $67.33 billion market capitalisation gives a ratio near 3.3%.
Read more: XRP Price Prediction
7. Solana (SOL)
Solana is a high-throughput blockchain built for applications that need many transactions settled quickly and cheaply, and it hosts a large share of crypto trading and meme-coin activity.
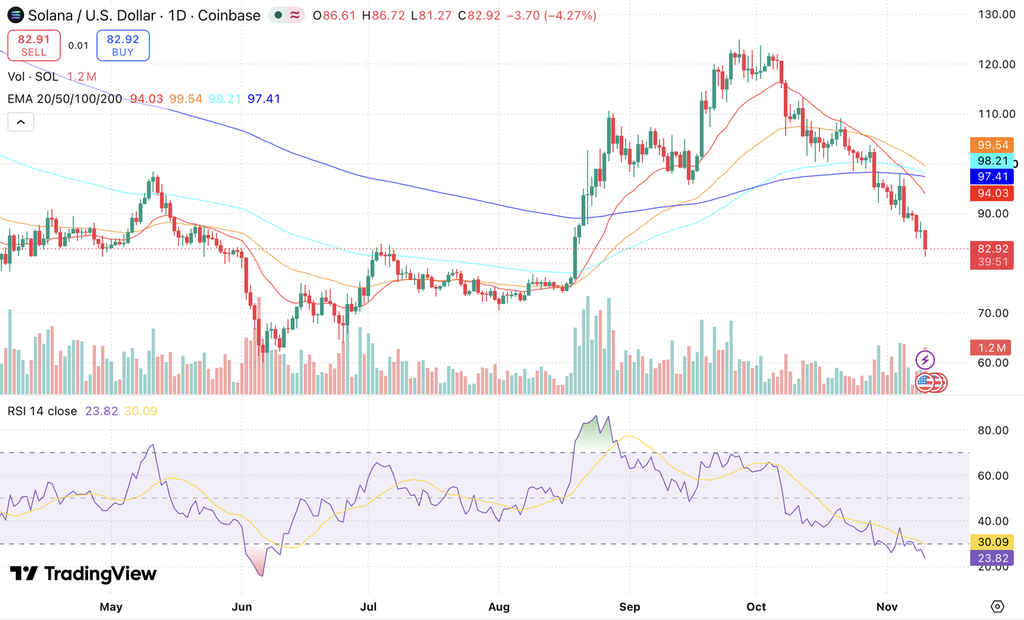
SOL Price Chart. Source: TradingView
| Metric | Data |
|---|---|
| Current Price | $83.86 |
| Market Capitalization | $49.59B |
| Circulating Supply | 591.4M SOL |
| Max Supply | n/a |
| 24h Volume | $2.48B |
| 2026 YTD Change | -32.5% |
Key Insights: Solana trades at $82.92, below the 20-day EMA at $94.03, the 200-day at $97.41, the 100-day at $98.21 and the 50-day at $99.54. RSI at 23.82 against a signal of 30.09 is the second-lowest on this list and deep into oversold territory. The chart shows a fall of 4.3% on the day and 14.1% over the week.
Why Consider SOL: Solana has no supply cap and issues new tokens through staking rewards, so the circulating supply grows over time. Daily turnover of $2.48 billion against a $49.59 billion market capitalization is a ratio near 5%, which is comfortable depth. It is down 32.5% over 2026.
Read more: Solana Price Prediction
8. Tron (TRX)
Tron is a blockchain used heavily for moving stablecoins, and a large share of all USDT transfers settle on it. That usage gives it steadier activity than most tokens of its size.
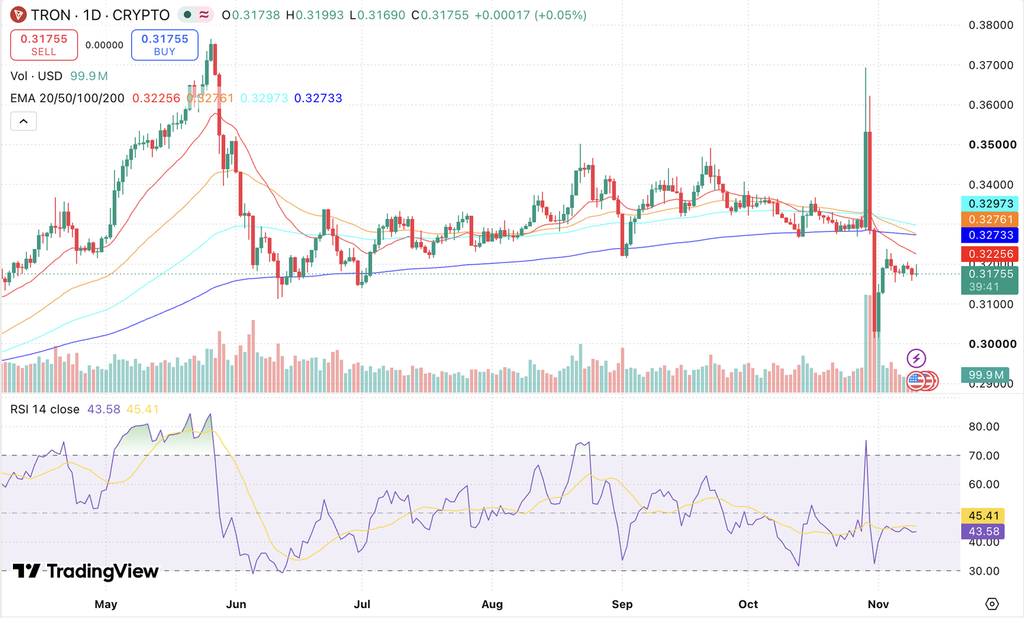
TRX Price Chart. Source: TradingView
| Metric | Data |
|---|---|
| Current Price | $0.3164 |
| Market Capitalization | $30.06B |
| Circulating Supply | 95.03B TRX |
| Max Supply | n/a |
| 24h Volume | $316.41M |
| 2026 YTD Change | +11.5% |
Key Insights: TRON has the flattest chart on this list. Price at $0.31755 sits below all four key averages, but those averages span just $0.0072, from the 20-day EMA at $0.32256 to the 100-day at $0.32973. RSI at 43.58 against a signal of 45.41 is mildly below neutral. The week’s move was a fall of 1.1%, the smallest of any token here.
Why Consider TRX: TRON’s stability is the notable feature rather than a limitation: it is the only non-stable coin on this list up over 2026, at 11.5%, in a year when the other seven fell. Against that, daily turnover of $316.41 million against a $30.06 billion market capitalization is a ratio near 1.1%, the thinnest on this list relative to size.
Read more: Tron Price Prediction
9. Hyperliquid (HYPE)
Hyperliquid is a decentralised exchange for perpetual futures that runs on its own chain, and HYPE is the token attached to it. It has moved up to ninth place by market capitalization.
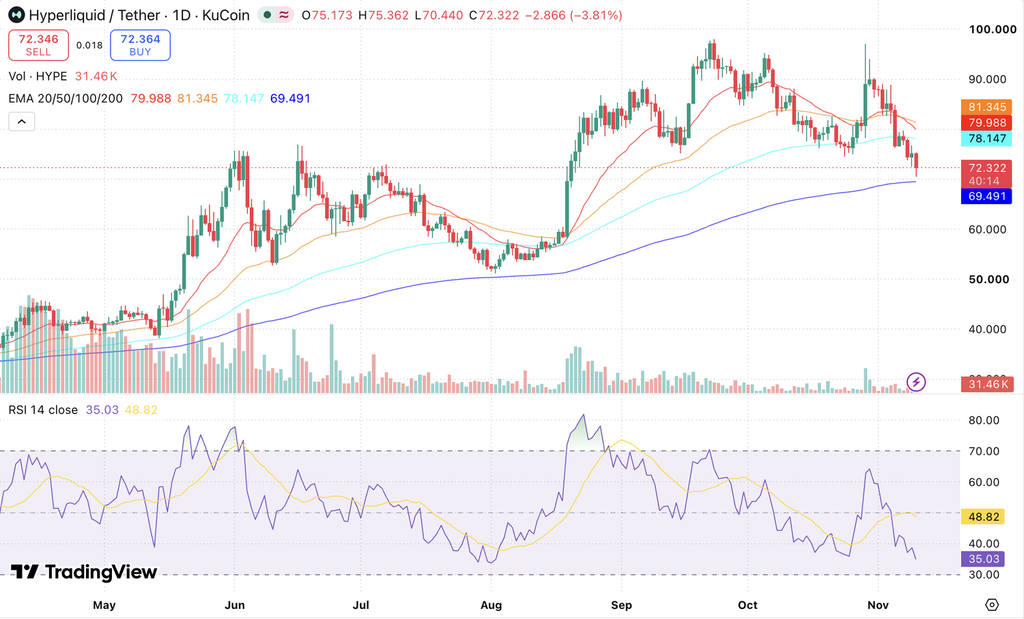
HYPE Price Chart. Source: TradingView
| Metric | Data |
|---|---|
| Current Price | $72.54 |
| Market Capitalization | $18.35B |
| Circulating Supply | 252.93M HYPE |
| Max Supply | 1,000,000,000 HYPE |
| 24h Volume | $1.17B |
| 2026 YTD Change | +186.7% |
Key Insights: Hyperliquid is one of only three tokens here holding any of its key averages. Price at $72.322 sits above the 200-day EMA at $69.491 but below the 100-day at $78.147, the 20-day at $79.988 and the 50-day at $81.345. RSI at 35.03 against a signal of 48.82 shows the widest gap between RSI and its signal line on this list, which is what a fast recent drop produces.
Why Consider HYPE: HYPE is up 186.7% over 2026, by far the largest gain on this list, and it fell 17.4% in the past week, so both figures matter to anyone looking at it now. Supply is capped at 1 billion with 252.93 million circulating, so roughly three quarters of the eventual supply has yet to reach the market, the largest undistributed share here.
Read more: Hyperliquid Price Prediction
10. Zcash (ZEC)
Zcash is a privacy-focused blockchain that lets users shield transaction details rather than publishing them openly, and it shares Bitcoin’s 21 million supply cap. It has slipped to tenth place after a sharp fall.
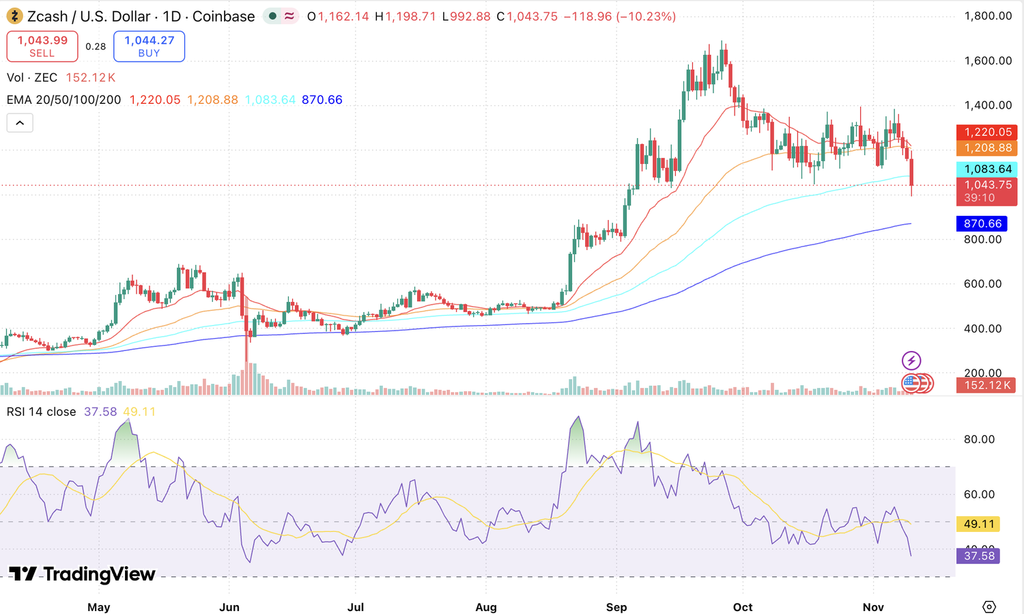
ZEC Price Chart. Source: TradingView
| Metric | Data |
|---|---|
| Current Price | $973.28 |
| Market Capitalization | $16.5B |
| Circulating Supply | 16.96M ZEC |
| Max Supply | 21,000,000 ZEC |
| 24h Volume | $1.47B |
| 2026 YTD Change | +92.0% |
Key Insights: Zcash fell 10.2% on the day shown and 27.5% over the week, the steepest decline of the ten on both counts. Price at $1,043.75 still sits above the 200-day EMA at $870.66 but below the 100-day at $1,083.64, the 50-day at $1,208.88 and the 20-day at $1,220.05. RSI at 37.58 against a signal of 49.11 is below neutral after that drop.
Why Consider ZEC: Zcash is up 92.0% over 2026 despite that week, so the gain and the drawdown need reading together. Its supply is capped at 21 million with 16.96 million issued. Daily turnover of $1.47 billion against a $16.5 billion market capitalization is a ratio near 8.9%, which is solid depth for an asset of this size.
Read more: Zcash Price Prediction
Bottom Line
The crypto market continues to evolve, offering multiple options for every type of investor. These are the ten largest crypto assets by market capitalization in November 2026, and every one of them fell over the past week, from TRON at 1.1% to Zcash at 27.5%. Conducting thorough research before investing is crucial. Always use a reliable crypto trading platform, such as CoinDCX, and assess any token against your own circumstances rather than against its position on a list.
Disclaimer
This article is for informational and educational purposes only and does not constitute investment advice. Crypto assets are volatile and unregulated in many jurisdictions, and there may be no regulatory recourse for losses. Prices and indicator values quoted here were read from live charts and will have changed by the time you read this. Always conduct independent research and assess your financial situation and risk tolerance before investing.
FAQs
Q1. Which crypto is best for long-term holding?
Long-term positions are most often built around Bitcoin and Ethereum, because they have the deepest liquidity, the longest track records and the clearest institutional access routes through spot ETFs. No token is suitable for every portfolio, and a long horizon does not remove the risk of large drawdowns along the way.
Q2. Which crypto has the strongest momentum right now?
None of the ten is in an uptrend. Seven trade below all four of their key moving averages, and only Tether, Hyperliquid and Zcash hold even one. On RSI, TRON reads highest at 43.58 and Solana and XRP lowest at 23.82 and 23.74, both deep in oversold territory after sharp weekly falls.
Q3. Which of these tokens has not yet recovered?
All ten fell over the past week, and seven of the ten trade below every one of their key moving averages: Bitcoin, Ethereum, BNB, USDC, XRP, Solana and TRON. XRP is furthest below, at roughly 22% under its 200-day EMA. Hyperliquid and Zcash still hold their 200-day averages.
Q4. Which crypto should a beginner start with at a low price?
Beginners often start with Bitcoin or Ethereum in fractional amounts rather than buying whole units of a lower-priced token. TRON and XRP have low unit prices but carry higher volatility, and TRON turns over only about 1.1% of its market capitalization a day, which is the thinnest market on this list.
Q5. Are stablecoins like USDT and USDC worth holding?
Stablecoins serve a different purpose from the other tokens in this list, since they are held for liquidity and stability rather than appreciation. Both USDT and USDC are currently trading within twelve hundredths of a per cent of their dollar pegs. The relevant risk is not price movement but reserve quality and issuer transparency, which is why reserve reporting matters more than any chart for these two.
Q6. How do I invest in these tokens from India?
Investing from India works through an FIU-IND registered exchange such as CoinDCX. The process involves signing up, completing KYC, adding funds in rupees through a supported payment method, then selecting the token and entering the amount. Indian tax rules treat crypto as Virtual Digital Assets, taxed at 30% plus surcharge and cess with 1% TDS on transfers, and losses cannot be set off against other income.
Additional Read:
1. Top Meme Tokens to Invest
2. Top Solana Meme Tokens to Buy
3. Coins With 1000x Potential
CoinDCX Research Team

Articles published on the CoinDCX blog are created and reviewed by a dedicated team of crypto and finance professionals with practical experience in digital assets, and personal finance. The team combines market data analysis, technical indicators, and fundamental research to deliver balanced, easy-to-understand insights for both beginners and experienced investors.

CoinDCX maintains strict editorial norms. Each article is researched using authentic sources like blockchain explorers, market data platforms, regulatory filings, and industry reports, and undergoes internal review to maintain accuracy, transparency, and trustworthiness.

However, we cannot guarantee the absolute accuracy of the data presented, as market conditions are constantly changing; thus, certain data may prove to be outdated or incorrect.


