


Our Cardano crypto price prediction analyzes ADA’s latest price action using RSI, MACD, moving averages, and key support and resistance levels. Discover today’s, weekly, monthly, and long-term forecasts through 2040, along with technical analysis and market outlook. Whether you’re a trader or long-term investor, this guide highlights potential price targets, trend direction, and important levels to watch based on current chart indicators.
Cardano (ADA) is currently trading at $0.1748, reflecting a bullish market sentiment as of July 21, 2026. The 14-day RSI stands at 45.51, signaling neutral conditions, while the 50-day and 200-day moving averages are positioned at $0.1749 and $0.1718, respectively. The MACD is negative, indicating bearish short-term momentum. Based on these technical indicators and broader market trends, ADA is expected to consolidate near the $0.1750 resistance while holding above the $0.1738 support zone. The recent Van Rossem Hard Fork going live has strengthened Cardano’s governance framework through on-chain approval and may continue supporting long-term investor confidence despite near-term consolidation.
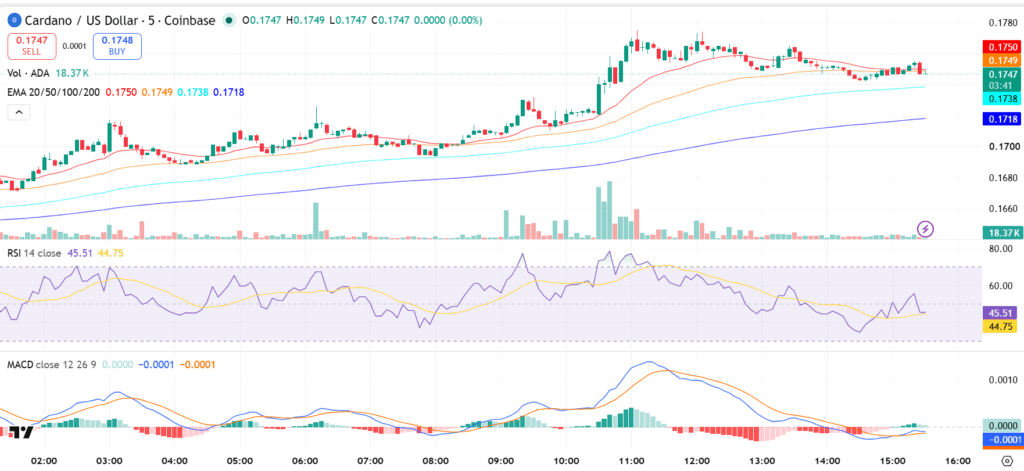
ADA/USD, Source TradingView
Key Insights
- Weekly & Monthly Outlook: ADA may continue consolidating between $0.1730 and $0.1780 this week before attempting another move above $0.1750 if buying volume improves.
- 2026 & 2030 Outlook: Through the remainder of 2026, ADA could gradually recover toward the $0.19-$0.22 region, while continued ecosystem growth could support significantly higher valuations by 2030.
- Technical Analysis: ADA remains above its 100-day EMA ($0.1738) and 200-day EMA ($0.1718), while RSI remains neutral and MACD is attempting stabilization after recent bearish momentum.
Cardano Short-Term Price Prediction – Today, This Week, July 2026
Here is the Cardano ADA price prediction 2026 for today, this week, and July 2026.
| Timeframe | Price Target | Support | Resistance | ROI |
| Next 24 Hrs | $0.1760 | $0.1738 | $0.1750 | +0.69% |
| This Week | $0.1780 | $0.1730 | $0.1780 | +1.83% |
| July 2026 | $0.1820 | $0.1718 | $0.1820 | +4.12% |
Cardano Price Prediction Today
Cardano is trading at $0.1748 and is expected to range between $0.1738 and $0.1760 in the next 24 hours. The RSI sits at 45.51 and the 20-EMA at $0.1750 signals slightly bearish short-term momentum. A hold above $0.1738 targets $0.1760; a break below risks a drop to $0.1718.
Cardano Coin Price Prediction for This Week
Cardano is projected to trade between $0.1730 and $0.1780 for the week of July 21-27, 2026. ADA is above the 100-day EMA at $0.1738, with the MACD histogram contracting, pointing to weak bearish momentum. A weekly close above $0.1750 opens $0.1780; a loss of $0.1730 targets $0.1718.
Cardano Price Prediction for July 2026
Cardano’s July 2026 price prediction targets $0.1820, with a range of $0.1718-$0.1820. ADA is above its 200-day MA at $0.1718, and the monthly RSI at 45.51 signals neutral conditions. A monthly close above $0.1820 would confirm bullish momentum heading into Q3 2026, supported by the successful Van Rossem Hard Fork going live, which upgraded Cardano to Protocol Version 11 through its on-chain governance process.
Cardano Coin Price Prediction for August 2026
Cardano’s August 2026 price prediction targets $0.1880, with a range of $0.1760-$0.1880. ADA is above its 200-day MA at $0.1718, and the monthly RSI at 45.51 signals neutral conditions. A monthly close above $0.1880 would confirm bullish momentum heading into Q3 2026.
Trade ADA in INR on ![]()
Deposit and withdraw in INR (₹).
No Conversion to Crypto Required.

Cardano Price Outlook 2026 (Medium Term)
| Month | Price Target | Support | Resistance | ROI |
| July 2026 | $0.1820 | $0.1718 | $0.1820 | +4.12% |
| Aug 2026 | $0.1880 | $0.1760 | $0.1880 | +7.55% |
| Sep 2026 | $0.1940 | $0.1820 | $0.1940 | +10.98% |
| Oct 2026 | $0.2000 | $0.1880 | $0.2000 | +14.42% |
| Nov 2026 | $0.2080 | $0.1940 | $0.2080 | +18.99% |
| Dec 2026 | $0.2200 | $0.2000 | $0.2200 | +25.86% |
Cardano’s 2026 price range is projected at $0.1718-$0.2200, driven by improving market sentiment and ecosystem developments. The 200-day MA at $0.1718 is the key bull/bear line, a hold above targets $0.2200, while a break below $0.1718 risks a drop to $0.1680. Weekly MACD is negative and RSI is trending below the midline, suggesting that while short-term momentum remains cautious, the broader trend stays constructive above long-term moving averages
Want to diversify beyond ADA? check out the Top 10 Cryptos To Invest In July 2026
Cardano Price Prediction 2026 to 2040 (Long Term)
| Year | Price Target | Support | Resistance | ROI |
| 2027 | $0.2500 | $0.2000 | $0.2800 | +43.02% |
| 2028 | $0.3500 | $0.2800 | $0.4000 | +100.23% |
| 2029 | $0.4800 | $0.3800 | $0.5500 | +174.60% |
| 2030 | $0.6500 | $0.5000 | $0.7500 | +272.08% |
| 2031 | $0.5800 | $0.4800 | $0.6500 | +231.81% |
| 2035 | $1.2000 | $0.9500 | $1.4000 | +586.76% |
| 2040 | $2.5000 | $2.0000 | $3.0000 | +1330.21% |
Read also: How to Buy Cardano Coin in India
Cardano 2030 Forecast: What Is the Expected Price?
Cardano price prediction 2030 targets $0.2600, within a range of $0.2250–$0.2800, fueled by sustained network growth and improving market adoption. Based on the current technical structure, ADA remains above its key moving averages and continues to show positive momentum. Stock-to-Flow and trend-based models support a range of $0.2250–$0.2800 under continued network growth.
Cardano 2031 Outlook and Expected Price Range
The Cardano price outlook for 2031 targets $0.2450, with a range of $0.2200–$0.2700, as the market enters a consolidation phase following the prior cycle’s gains. Cycle analysis suggests 2031 may mirror the 2026 pattern — either consolidating from a previous peak or building a new base. LTH supply and exchange reserve trends will be the key on-chain signals to monitor.
Cardano 2040 Long-Term Forecast
By 2040, Cardano price forecast projections target $0.4500, ranging from $0.4000 to $0.5000, assuming continued ecosystem development and adoption. Metcalfe’s Law and trend-growth models point to $0.4000–$0.5000 under moderate adoption; aggressive scenarios exceed $0.5000. These forecasts carry high uncertainty and should be read as scenario ranges, not fixed targets.
Cardano Technical Analysis
The following technical indicators were used to derive the price predictions above. Each indicator’s value and signal should be updated at the time of publishing.
| Indicator | Value | Signal |
| Relative Strength Index (14-Day RSI) | 45.51 | Neutral |
| 50-Day Moving Average | $0.1749 | Bearish |
| 200-Day Moving Average | $0.1718 | Bullish |
| MACD | -0.0001 | Bearish |
| MACD Histogram | 0.0000 | Negative |
| Average Trading Volume (30-Day) | $479.62M | Increasing |
Relative Strength Index (RSI)
The 14-day RSI is at 45.51, signaling neutral (30-70) conditions. RSI in the 40-60 range reflects market indecision, meaning the next major catalyst will likely determine ADA’s short-term direction.
Moving Averages (50-Day & 200-Day MA)
ADA is below its 50-day MA at $0.1749 and above its 200-day MA at $0.1718. This suggests a short-term recovery within a broader uptrend, with the 50-day MA acting as immediate resistance while the 200-day MA remains key support.
MACD (Moving Average Convergence Divergence)
The MACD is below the signal line with a histogram of 0.0000, indicating bearish momentum. Momentum is flattening, suggesting a directional breakout is likely within the next few sessions if price moves decisively above or below nearby support and resistance.
Volume Analysis
Cardano’s average daily trading volume over the past 30 days is approximately $479.62 million. Rising volume confirms improving market participation following the recent price advance, supporting the possibility of trend continuation if buying pressure persists.
1. How much will 1 Cardano be worth in 2030?
By the year 2030, 1 Cardano (ADA) is projected to be worth anywhere from $0.20 to $5.52, depending heavily on whether the network achieves its long-term enterprise goals.
2. Can Cardano reach $10?
Yes, Cardano (ADA) reaching $10 is theoretically possible, but it would require a massive market expansion and widespread adoption. For ADA to hit this milestone from its current price, it would need a roughly 2,000% to 2,500% increase, translating to a market capitalization of over $350 billion.
3. Will Cardano go back to $3?
Cardano (ADA) reaching $3 again is considered highly improbable in the near term by most mainstream forecasting models. After an extended market slowdown that dropped the token's price to the $0.16 range, reaching its $3.10 all-time high from 2021 would require a massive 18x to 20x price surge, which analysts do not see as a base-case scenario.
4. How high will Cardano go in 5 years?
Forecasts for Cardano (ADA) over the next 5 years vary widely. Mainstream models suggest a price between $0.20 and $3.10. Conservative estimates project a gradual rise to around $0.35 to $0.55, while highly optimistic models predict it could reach $5 to $6 by 2030.
5. Can Cardano ADA hit $100?
Yes, Cardano (ADA) reaching $100 is highly improbable and mathematically unrealistic in the foreseeable future, as it would require a market capitalization of roughly $3.5 trillion to $4.5 trillion. For context, this exceeds the total combined valuation of the entire global cryptocurrency market
6. Is Cardano a good buy in 2026?
Cardano (ADA) is currently a highly speculative buy, trading around $0.16, which represents a roughly 95% drop from its 2021 all-time high. It is best suited for long-term investors comfortable with high volatility
7. Does Cardano have a future?
Cardano (ADA) maintains a long-term future backed by a robust, research-driven blockchain and an active developer community. However, its future growth is viewed with mixed opinions; while supporters praise its technical foundation and governance, critics argue it lags behind rivals in user adoption and ecosystem growth.
8. Which is better, Ethereum or Cardano?
Whether Ethereum or Cardano is "better" depends strictly on your goals, as Ethereum dominates in market adoption and financial activity, while Cardano leads in academic security and energy-efficient scaling architecture.
9. Can ADA hit 1$?
Yes, ADA can technically reach $1, though analysts consider it a long-term goal rather than an immediate certainty.
10. What is the future price of Cardano?
Cardano (ADA) is trading around $0.16 to $0.17. Mainstream algorithmic forecasts suggest a long-term trading range, with average price projections hovering between $0.20 and $0.50 by 2030, as the ecosystem works through historical volatility and scaling upgrades.
11. How high will Cardano go in 2026?
For 2026, forecasts for Cardano (ADA) are divided but generally center around a recovery range of $0.28 to $0.70. The most bullish projections suggest ADA could reach $1.00 to $1.25 if the ecosystem experiences rapid adoption, while more conservative estimates anticipate it staying closer to $0.17.
12. How low can ADA go?
Cardano (ADA) currently trades around $0.17. In bearish scenarios and broader market sell-offs, analysts suggest ADA could test a major historical support zone between $0.09 and $0.14, a structural floor dating back to 2020 and 2021. Some forecasters estimate short-term lows to hover around $0.16.
13. Is ADA better than XRP?
Neither Cardano (ADA) nor XRP is universally "better"; rather, they serve completely different purposes. The best choice depends on what you are trying to accomplish.
Disclaimer: This article is for informational purposes only and does not constitute financial or investment advice. Crypto markets are highly volatile. Always do your own research (DYOR) before making any investment decisions.

