This guide provides an Ethereum crypto price prediction using technical indicators such as the Relative Strength Index (RSI), Exponential Moving Averages (EMAs), and volume profiles. Explore ETH price forecasts for today, this week, and the long term through 2040, along with key support and resistance levels, momentum analysis, and market outlooks.
Ethereum (ETH) trades near $2,407.3 as of October 19, 2026, up 0.32% on the session after opening at $2,399.3 and recovering from an intraday dip to $2,326.5. The 14-day RSI stands at 38.00, down from 39.69 at the last update, and remains below the 50 neutral threshold, trailing its signal moving average at 42.87 by 4.87 points. Concurrently, the 20-day, 50-day, 100-day, and 200-day EMAs are positioned at $2,512.9, $2,484.9, $2,357.4, and $2,311.9, respectively. The 100-day EMA sits $45.5 above the 200-day line, extending the golden cross spread from $45.3 and preserving higher-timeframe alignment across the moving average stack even as the 20-day and 50-day averages keep falling. Since an October 16 rally stalled beneath the 50-day EMA, each session has posted a lower high, while long lower wicks continue defending the $2,312 to $2,357 band between the 200-day and 100-day EMAs. A close above the 50-day EMA at $2,484.9 is still needed to turn this base into a recovery.
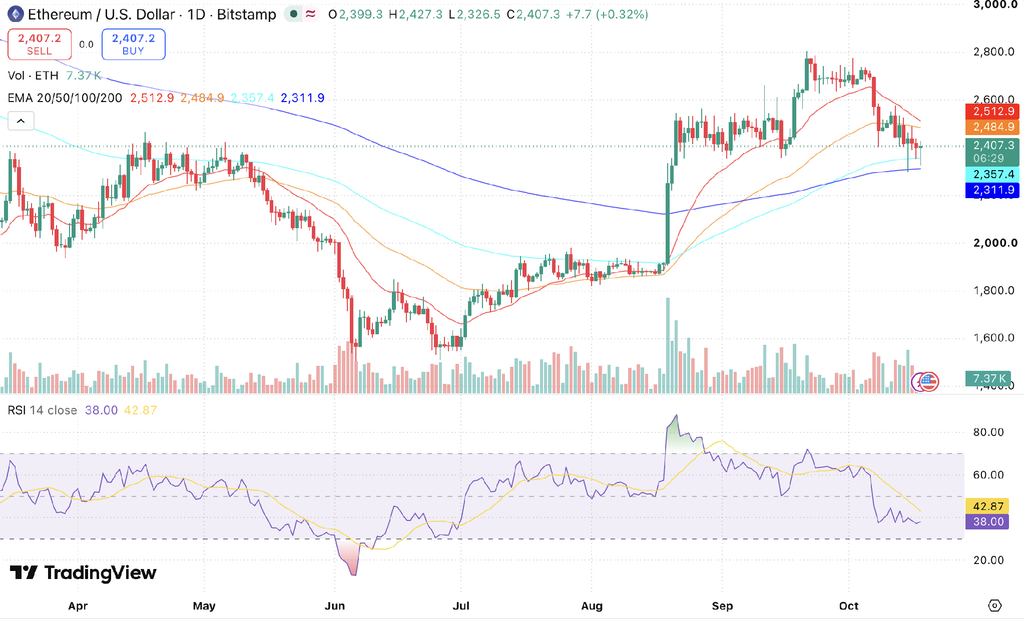
ETH/USD daily chart data sourced from TradingView
Key Insights
- Short-term outlook: ETH opened at $2,399.3, swung between $2,326.5 and $2,427.3, and trades near $2,407.3 within a $100.8 daily range. Immediate support rests at the 100-day EMA at $2,357.4, followed by the 200-day EMA at $2,311.9 and the $2,300 low, while the 50-day EMA at $2,484.9 and the 20-day EMA at $2,512.9 serve as overhead resistance.
- Medium to long-term outlook: The 100-day EMA at $2,357.4 has pulled $45.5 above the 200-day EMA at $2,311.9, extending from $45.3 and confirming that the second golden cross continues to widen, though only marginally. The 50-day EMA at $2,484.9 continues to edge lower, sitting $127.5 above the 100-day line and $173.0 above the 200-day line, with the spot price currently 3.1% beneath it.
- Technical analysis: RSI stands at 38.00, down from 39.69 at the previous check, trailing its signal line at 42.87 by 4.87 points. Volume reached 7.37K ETH with the candle roughly 99% complete, less than half the 16.55K printed at the last update—as the weekend dip to $2,326.5 drew thin turnover.
Ethereum Short-Term Price Prediction – Today, This Week, October 2026
Here is the ETH price prediction 2026 for today, this week, and October 2026.
| Timeframe | Price Target | Support | Resistance | ROI |
|---|---|---|---|---|
| Next 24 Hrs | $2,435 | $2,357 | $2,485 | +1.15% |
| This Week | $2,460 | $2,300 | $2,513 | +2.19% |
| October 2026 | $2,500 | $2,300 | $2,600 | +3.85% |
Ethereum Price Prediction Today
Ethereum’s 24-hour target stands at $2,435 (+1.15%), with expected price action spanning $2,357 to $2,485. ETH trades near $2,407.3 after a weekend dip to $2,326.5 cut through the 100-day EMA and stopped $14.6 above the 200-day EMA, where buyers stepped in to lift the price $80.8 off the low. Securing a daily close above $2,427 is required to open a retest of the 50-day EMA at $2,484.9, whereas losing the 100-day EMA at $2,357.4 on a closing basis would put the 200-day EMA at $2,311.9 and the $2,300 low back in play. The session’s long lower wick is the third in four sessions, showing that buyers are still defending the 100-day and 200-day band.
Ethereum Coin Price Prediction for This Week
The weekly forecast for ETH is $2,460, within an expected channel of $2,300 to $2,513. The October 16 recovery attempt stalled just beneath the 50-day EMA, and each session since has printed a lower high while dips into the 100-day EMA continue to draw buyers. That leaves ETH compressing between a flat floor at $2,300 to $2,357 and a falling ceiling, with the 20-day EMA at $2,512.9 shedding $36.5 since the last update. The 20-day line now sits only $28.0 above the 50-day EMA, so a bearish crossover between the two is likely this week unless the price recovers quickly. A daily close above $2,485 would reclaim the 50-day EMA and open a retest of the 20-day line near $2,513, whereas a daily close beneath the 200-day EMA at $2,311.9 would be the first since the mid-August breakout and open the way to a deeper retracement.
| Read more: How to buy Ethereum in India |
Ethereum Price Prediction for October 2026
Ethereum’s October 2026 price is projected to reach $2,500, within a monthly range of $2,300 to $2,600. With less than two weeks left in the month, reaching the $2,500 target depends on reclaiming the converging 50-day and 20-day EMAs, now at $2,484.9 and $2,512.9. The 100-day and 200-day EMAs, which have absorbed every dip since October 15, provide the structural floor beneath this recovery, and the golden cross between them is still widening. Two catalysts fall in late October: the Glamsterdam fork on the Hoodi testnet on October 26 and the Federal Reserve interest rate decision on October 27–28. If $2,300 fails on a daily closing basis, ETH will register its first close below the 200-day EMA since its mid-August breakout, placing the macro trend under pressure.
Ethereum Coin Price Prediction for November 2026
November 2026 carries a $2,700 target, with an expected trading range of $2,400 to $2,900. This trajectory assumes October establishes a recovery base above $2,500. The 50-day EMA at $2,484.9 is still falling and must resume its upward slope to reinforce the broader trend, as a 20-day crossover beneath it would make that recovery slower to build. A November close below $2,400 would delay the recovery sequence and push the $2,900 year-end target into 2027.
Ethereum Price Prediction 2026 (Medium Term)
| Month | Price Target | Support | Resistance | ROI |
|---|---|---|---|---|
| Oct 2026 | $2,500 | $2,300 | $2,600 | +3.85% |
| Nov 2026 | $2,700 | $2,400 | $2,900 | +12.16% |
| Dec 2026 | $2,900 | $2,600 | $3,100 | +20.47% |
Ethereum’s 2026 price range is projected at $2,300 to $2,900. The moving average structure is holding but no longer improving across the board: the 50-day EMA at $2,484.9 is $127.5 above the 100-day EMA at $2,357.4, narrowing from $140.4, while the 100-day EMA has pulled $45.5 above the 200-day EMA at $2,311.9. The macro trend remains protected as the spot price holds a 4.1% cushion above the 200-day line, which has not been breached on a closing basis since mid-August, with the 100-day EMA functioning as the first structural floor beneath current levels.
| Want to diversify beyond Ethereum? Check out the Top 10 Cryptos To Invest In 2026 |
Ethereum Price Prediction in INR (2026–2030)
For Indian traders, here is what the ETH price targets translate to in rupees.
| Period | ETH Target USD | ETH Price INR est. |
|---|---|---|
| October 2026 | $2,500 | ₹2,37,250 |
| December 2026 | $2,900 | ₹2,75,210 |
| 2027 | $3,600 | ₹3,41,640 |
| 2030 | $5,600 | ₹5,31,440 |
INR estimates based on a USD/INR rate of ~₹94.9. Rate fluctuations will affect actual INR values.
Ethereum Long-Term Price Outlook (2027–2040)
The long-term outlook for ETH rests on three structural drivers: continued dominance as the leading smart contract platform, the 2028 Bitcoin halving cycle’s indirect impact on the broader digital asset market, and institutional adoption through regulated ETF products.
The following forecasts are derived from network-adoption and Metcalfe-style models, broader Bitcoin halving-cycle analysis, and historical ETH volatility patterns. They represent scenario ranges, not price targets.
| Year | Price Target | Support | Resistance | ROI |
|---|---|---|---|---|
| 2027 | $3,600 | $2,900 | $4,200 | +49.55% |
| 2028 | $4,000 | $3,200 | $4,800 | +66.16% |
| 2029 | $4,800 | $3,800 | $5,600 | +99.39% |
| 2030 | $5,600 | $4,500 | $6,800 | +132.63% |
| 2031 | $6,200 | $5,000 | $7,500 | +157.55% |
| 2035 | $9,500 | $7,500 | $12,000 | +294.63% |
| 2040 | $14,000 | $11,000 | $18,000 | +481.56% |
Where Will Ethereum Price Go in 2030?
Ethereum’s 2030 baseline target is $5,600, within an estimated channel of $4,500 to $6,800, driven by post-2028 liquidity and institutional portfolio allocations. Without an absolute supply cap, Ethereum’s scarcity profile depends on net issuance mechanics: EIP-1559 base-fee burning combined with rising staking lockups can create deflationary supply pressure during sustained on-chain throughput.
Where Will Ethereum Price Go in 2031?
The Ethereum price prediction for 2031 targets $6,200, within an expected range of $5,000 to $7,500, as the asset enters a post-cycle digestion phase. Historical data points to 2031 functioning as a consolidation window following multi-year expansion, with validator staking ratios, Layer-2 roll-up settlement volume, and exchange reserves serving as primary health indicators.
Where Will Ethereum Price Go in 2040?
By 2040, Ethereum’s price is projected to reach $14,000, fluctuating within a long-term adoption band of $11,000 to $18,000. Under aggressive smart contract settlement scenarios, upper-boundary models exceed $25,000. These secular figures represent multi-decade analytical projections rather than guaranteed price targets.
Ethereum Technical Analysis
The following technical indicators were used to derive the Ethereum price prediction above.
| Indicator | Value | Signal |
|---|---|---|
| Relative Strength Index (14-Day RSI) | 38.00 | Below 50, down from 39.69 |
| RSI Moving Average | 42.87 | RSI now 4.9 points below it |
| 20-Day EMA | $2,512.9 | Resistance, price 4.2% below |
| 50-Day EMA | $2,484.9 | Resistance, price 3.1% below |
| 100-Day EMA | $2,357.4 | Now $45.5 above the 200-day EMA |
| 200-Day EMA | $2,311.9 | Golden cross floor, price 4.1% above |
| Trading Volume, session to date | 7.37K ETH | Candle roughly 99% complete |
Relative Strength Index (RSI)
The 14-day RSI stands at 38.00, down from 39.69 at the last update after red sessions on October 16 and 17. It remains beneath the 50 neutral baseline and trails its signal moving average at 42.87 by 4.87 points, a gap that has narrowed from 8.14 points because the signal line is falling faster than the RSI itself. The oscillator dipped marginally below its October 8 trough of 37.55 on October 17 before recovering to 38.00, meaning momentum is not yet displaying the bullish divergence needed to confirm a durable bottom. A move back above the signal line, alongside a daily close above the 50-day EMA at $2,484.9, would be the first sign of momentum turning, whereas a sustained RSI print below 37.55 would expose the 200-day EMA at $2,311.9.
Exponential Moving Averages – 20-Day, 50-Day, 100-Day and 200-Day EMA
ETH remains below the 20-day and 50-day EMAs, trading 3.1% under the 50-day at $2,484.9 and 4.2% below the 20-day at $2,512.9, while holding 2.1% above the 100-day EMA at $2,357.4 and 4.1% above the 200-day EMA at $2,311.9. The second golden cross has widened to $45.5 from $45.3, showing that the 100-day line is still pulling away from the 200-day EMA, though the pace has slowed to a crawl. The short end continues to deteriorate: the 20-day line has fallen another $36.5 since the last update, the 50-day has slipped $9.7, and the spread between them has compressed to $28.0 from $54.8. If the price holds near current levels, the two lines will cross in about six sessions, around October 24, ahead of the Hoodi fork and the Fed meeting. A daily close back above $2,513 is the level required to halt the 20-day slide and delay that crossover.
Volume Analysis
Session volume reached 7.37K ETH with roughly 99% of the daily candle complete, which is less than half the 16.55K recorded at the last update. The weekend dip to $2,326.5 therefore occurred on thin turnover, and buyers lifted the price $80.8 off the low without heavy participation on either side. That points to selling pressure fading at the 100-day and 200-day band rather than fresh demand arriving. A daily close above $2,485 on expanding volume would signal demand returning, while a close below $2,300 on high turnover would indicate that the sell-off is resuming.
What Is the Ethereum Price Prediction for Indian Traders?
ETH trades near ₹2,28,500 on CoinDCX in INR, with no USD conversion or international transfer required. Against the 2030 base case of ₹5,31,440, that is a potential 2.3x gain over four years. The Glamsterdam upgrade went live on the Sepolia testnet on October 6 as scheduled, and the Hoodi testnet fork remains set for October 26, with mainnet deployment still targeted for Q4 2026 without a firm date announced. ETH has held the $2,300 to $2,357 band through three dips since October 15; however, with the RSI at 38.00 and the 20-day EMA closing in on a bearish cross with the 50-day, that band remains the critical area buyers must defend.
Disclaimer: This article is for informational purposes only and does not constitute financial or investment advice. Digital asset markets are highly volatile and prices can change rapidly. Past performance is not indicative of future results.
FAQs
Q1. Will Ethereum go up?
Ethereum will head higher if it closes back above the 50-day EMA at $2,484.9 and then clears the 20-day EMA at $2,512.9. Repeated defense of the 100-day and 200-day EMAs since the October 15 flush and a widening 100-day/200-day golden cross support the higher-timeframe trend, though short-term momentum remains weak with the RSI at 38.00 and requires defending the $2,300 to $2,357 support corridor.
Q2. What will 1 ETH be worth in 2030?
According to the price prediction models used in this analysis, 1 ETH will be worth around $5,600 in 2030, within an expected range of $4,500 to $6,800. Long-term gains depend on higher Layer-2 usage, staking adoption, and continued institutional demand through spot ETFs.
Q3. Is it better to buy Bitcoin or Ethereum?
Bitcoin and Ethereum serve complementary portfolio functions. Bitcoin functions primarily as a digital store of value with a hard supply cap of 21 million tokens. Ethereum acts as a decentralized execution layer powering smart contracts, DeFi ecosystems, and Layer-2 rollups while distributing staking rewards. Many investors maintain allocations to both assets for balanced market exposure.
Q4. What is Ethereum's all-time high (ATH)?
Ethereum recorded an all-time high of approximately $4,946 in August 2025, surpassing its prior peak of $4,878 set in November 2021. Analysts track this level as major secular resistance during multi-year expansion phases.
Q5. Is Ethereum dead?
No. Ethereum leads the digital asset sector in developer activity, total value locked (TVL), and institutional adoption. Protocol upgrades continue schedule, with the Glamsterdam hard fork targeted for Q4 2026 mainnet deployment following testnet execution.
Q6. Is Ethereum a good investment in 2026?
Whether Ethereum is a good investment depends on entry timing more than trend direction. The base case puts ETH between $2,300 and $2,900 through the rest of the year. The second golden cross keeps widening and the 100-day and 200-day EMAs have absorbed every dip since October 15, but the RSI at 38.00 remains below 50 and the 20-day EMA is closing in on a bearish cross with the 50-day.
Q7. How is Ethereum taxed in India?
Profits from selling ETH are taxed at a flat 30% plus 4% cess under Section 115BBH, whatever your slab or holding period. A 1% TDS applies under Section 194S, and losses cannot be set off or carried forward. Report each transaction in Schedule VDA. See our guide to crypto taxes in India for the full rules.
Q8. What is the Glamsterdam upgrade and will it push ETH higher?
Glamsterdam is Ethereum’s next major hard fork, targeted for mainnet deployment in Q4 2026 after going live on the Sepolia testnet on October 6, with the Hoodi testnet fork scheduled for October 26. It introduces native proposer-builder separation and block-level access lists to support parallel execution and enhance transaction throughput.
Q9. Where can I buy Ethereum in India?
You can buy Ethereum directly with rupees on CoinDCX, an FIU-IND registered crypto exchange. Depositing INR avoids foreign exchange fees, and the platform provides compliant tax reporting tools for local regulations.