


BTC is coiling just under its $87,300 high and the 14-day RSI has flattened at its signal line, while the 100-day EMA extends its golden cross above the 200-day EMA. This Bitcoin price prediction evaluates short-term, medium-term, and multi-year outlooks through 2040, analyzing critical support zones, overhead resistance markers, and technical momentum indicators.
Bitcoin is trading near $85,500 as of October 7, 2026, down 0.30% on the session and 2.1% below its recent high. The rebound has settled into consolidation, with the session spanning $1,556 between $85,121 and $86,677 before fading off the high. That leaves the price 3.9% above the former ceiling at $82,281 cleared in September, with the session high coming within $623 of the $87,300 top.
The 14-day RSI at 63.19 has flattened just beneath its 63.98 signal line, a pause rather than a reversal of the recovery flagged in the previous update. The broader structural picture continues to firm: spot price trades 13.9% above the 200-day EMA at $75,051, while the 100-day EMA widens its golden cross above the 200-day line. Based on these technical indicators, Bitcoin is positioned to grind at overhead resistance between $86,677 and $87,300 while treating $85,121 as immediate support.
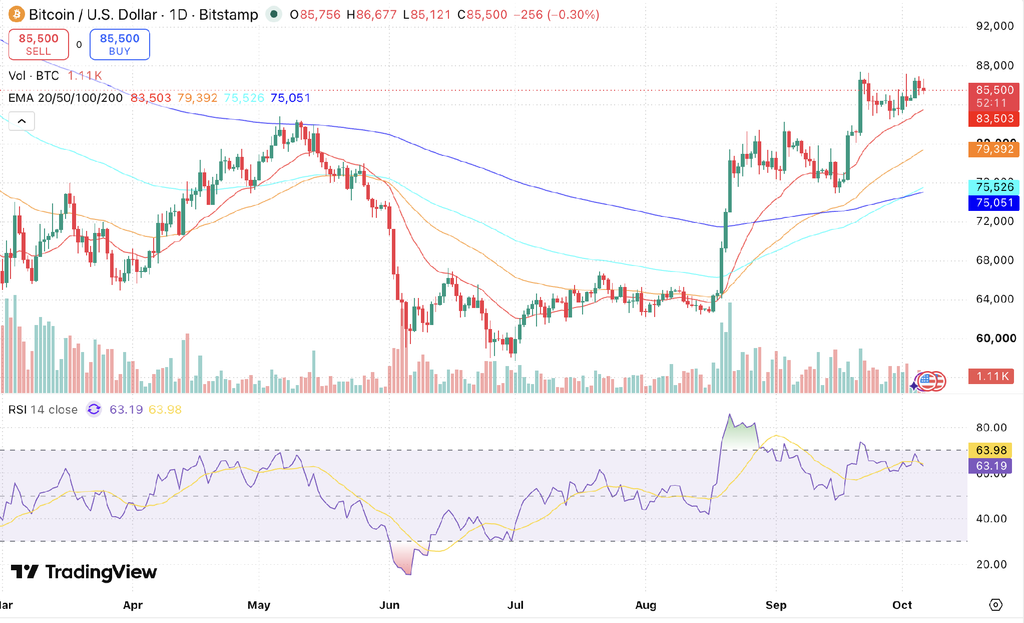
BTC/USD daily chart, Source: TradingView
Key Insights
- Bitcoin price today: BTC trades near $85,500, slipping 0.30% on the session as price consolidates after an attempt at recent cycle peaks stalled at $86,677.
- Short-term outlook: The recovery has flattened into a range, leaving price 3.9% above the $82,281 breakout level and 13.9% above the 200-day EMA at $75,051.
- Next 24 hours: BTC targets $86,000, with immediate horizontal support at $85,121 and overhead resistance at $86,677.
- This week: BTC targets $86,800 this week, with buyers defending the 20-day EMA at $83,503 while aiming to clear $87,300.
- October 2026 outlook: BTC targets $87,000, provided the $82,281 breakout level holds as support.
Bitcoin Short-Term Price1 Prediction – Today, This Week, October 2026
Here is the Bitcoin price prediction for today, this week, October 2026 and November 2026.
| Timeframe | Price Target | Support | Resistance | ROI |
|---|---|---|---|---|
| Next 24 Hrs | $86,000 | $85,121 | $86,677 | +0.58% |
| This Week | $86,800 | $83,503 | $87,300 | +1.52% |
| Oct 2026 | $87,000 | $83,503 | $92,000 | +1.75% |
Bitcoin Price Outlook Today
The Bitcoin price today is forecast at $86,000, a little above the $85,500 where BTC is trading now, after the session faded 0.30% from a push that stalled at $86,677. Immediate support begins at the session low of $85,121, followed by the 20-day EMA at $83,503, while overhead resistance aligns with the session high at $86,677. Clearing $86,677 brings the $87,300 peak directly into focus, whereas losing $85,121 exposes the $82,281 breakout shelf. The macro trend only fails outright on a confirmed daily close beneath the 200-day EMA at $75,051.
BTC Price Prediction for Tomorrow
Tomorrow, BTC is expected to change hands around $86,000, with support at $85,121 and resistance at $86,677 defining the likely daily channel. That forecast relies on the $85,121 session low holding, with the 20-day EMA at $83,503 positioned beneath it to reinforce the floor. Clearing $86,677 reopens the path toward $87,300, while a confirmed close below $83,503 would open the way back toward the $82,281 breakout shelf.
BTC Price Prediction for This Week
Over the next seven days, BTC is projected to settle near $86,800, within a band running from $83,503 to $87,300. Near-term bias still leans higher, though the 14-day RSI flattening at its 63.98 signal line argues for a grind rather than a surge. A weekly close above $87,300 would confirm the breakout continuation and open the path toward $89,000. Conversely, a weekly close beneath the 20-day EMA at $83,503 would signal caution, as it would surrender the ground established throughout September.
BTC Price Prediction for October 2026
October 2026 points to $87,000 as the base case for BTC, with $92,000 on the bullish side and $83,503 as the floor. Reaching this milestone requires the $82,281 breakout level and the 20-day EMA at $83,503 to hold as a unified support pocket, giving buyers a base to extend from across the month. The structural case keeps strengthening because the 50-day EMA at $79,392 now sits $4,341 above the 200-day at $75,051, and the 100-day at $75,526 has widened its own cross to $475 as well. A monthly close below $83,503 would call the breakout into question and put the 50-day EMA at $79,392 in view.
BTC Price Prediction for November 2026
By the end of November 2026, BTC is projected to reach $90,000, with an upside target of $95,000 and a downside case at $79,000. November’s performance builds on the base October established; a monthly close above $87,000 serves as the primary technical prerequisite, supported by the 100-day EMA now stacked above the 200-day line. Above $87,000, subsequent levels sit at $90,000 and the $95,000 upper boundary. On pullbacks, $79,000 is the first level that matters, and a monthly close below the 200-day EMA at $75,051 would end the trend that started in August.
Bitcoin Price Prediction 2026 (Medium Term)
| Month | Price Target | Support | Resistance | ROI |
|---|---|---|---|---|
| Oct 2026 | $87,000 | $83,503 | $92,000 | +1.75% |
| Nov 2026 | $90,000 | $79,000 | $95,000 | +5.26% |
| Dec 2026 | $92,000 | $75,051 | $97,000 | +7.60% |
Bitcoin’s medium-term price channel for 2026 is projected at $75,526 to $97,000, with the baseline lifted as the 100-day EMA has ascended to $75,526. The 200-day EMA at $75,051 remains the primary macro dividing line. Maintaining spot price above this moving average preserves the broader upward trajectory toward the year-end target of $92,000, while a confirmed close below it would signal a cycle failure.
Bitcoin Price Prediction 2026 to 2040 (Long Term)
| Year | Price Target | Support | Resistance | ROI |
|---|---|---|---|---|
| 2027 | $100,000 | $89,000 | $108,000 | +16.96% |
| 2028 | $109,000 | $97,000 | $119,000 | +27.49% |
| 2029 | $118,000 | $105,000 | $127,000 | +38.01% |
| 2030 | $127,000 | $119,000 | $136,000 | +48.54% |
| 2031 | $136,000 | $125,000 | $148,000 | +59.06% |
| 2035 | $159,000 | $142,000 | $176,000 | +85.96% |
| 2040 | $188,000 | $165,000 | $210,000 | +119.88% |
Read our related guide: How to buy Bitcoin
Bitcoin 2030 Forecast: What Is the Expected Price?
The 2030 projection targets $127,000, within an estimated range of $119,000 to $136,000, driven by programmatic supply reductions following the 2028 halving and expanding institutional balance sheet custody. By 2030, over 20.5 million BTC will have been mined, roughly 98% of the 21 million cap, making scarcity a primary valuation anchor. Stock-to-Flow and Power Law models support this range under continued network growth.
Bitcoin 2031 Outlook and Expected Price Range
The Bitcoin price forecast for 2031 targets $136,000, with a range of $125,000 to $148,000, as the market enters the post-2028 halving digestion phase. Historical four-year cycle models suggest 2031 will serve as a consolidation and base-building period following the post-halving peak. Long-term holder (LTH) supply metrics and exchange reserve outflows will remain critical on-chain indicators.
BTC 2040 Long-Term Forecast
By 2040, Bitcoin price prediction 2040 projects a price target of $188,000, ranging from $165,000 to $210,000, with over 99% of total supply issued. Multi-decade models rely on global institutional reserve adoption and transaction fee revenue sustainability. These projections represent analytical scenario ranges rather than fixed price guarantees.
Bitcoin Technical Analysis
The BTC/USD daily chart shows the recovery settling into a range, with the session spanning $1,556 between $85,121 and $86,677. BTC clears the 200-day EMA by 13.9%, holding its rebuilt cushion, and the session high came within $623 of the $87,300 top. RSI at 63.19 has flattened just beneath its 63.98 signal line. The following technical indicators were used to derive the price predictions above.
| Indicator | Value | Signal |
|---|---|---|
| Relative Strength Index (14-Day RSI) | 63.19 | Neutral, just below signal |
| 20-Day EMA | $83,503 | Bullish (price above) |
| 50-Day EMA | $79,392 | Bullish (cross above 200-day widening) |
| 100-Day EMA | $75,526 | Bullish (price above) |
| 200-Day EMA | $75,051 | Bullish (price above) |
| Average Trading Volume | Subdued in consolidation | Neutral |
Exponential Moving Average Analysis
Bitcoin trades above all four key moving averages, and the cushion over the 200-day EMA at $75,051 is holding steady at 13.9%. That moving average capped every recovery attempt earlier in the year, so maintaining a double-digit margin keeps the medium-term trend constructive even as near-term pullbacks test support.
The 20-day EMA has climbed to $83,503 and now sits 2.4% beneath price, so the first line of support keeps rising to meet the market. The 50-day at $79,392 has widened its cross above the 200-day at $75,051 to $4,341. Further down, the 100-day at $75,526 has extended its new cross above the 200-day to $475, reinforcing the second confirmation of the trend change.
Support and Resistance Levels
Support starts at the session low of $85,121, then the 20-day EMA at $83,503, with the $82,281 breakout level and the 50-day at $79,392 below that. Resistance begins at $86,677, then $87,300 and $89,000.
The $82,281 level and the 20-day EMA at $83,503 now frame a support zone $1,222 deep, and it has already absorbed one full retest. That zone is what decides the next move, because it is held under real selling pressure and the rising 20-day keeps lifting its upper edge. A close below $83,503 would be the first serious warning and a close below the 200-day EMA at $75,051 would end the trend.
Volume Analysis
Turnover has stayed subdued through the consolidation, with neither side committing size beneath the $87,300 high. Quiet two-way trade at these levels reads as a market waiting for a catalyst rather than distributing. A decisive push through $87,300 will require expanding volume on green candles to confirm fresh buyer commitment.
Disclaimer: This article is for informational purposes only and does not constitute financial or investment advice. Crypto markets are highly volatile. Always do your own research (DYOR) before making any investment decisions.
FAQs
1. What will Bitcoin be worth in 2026?
Based on the current daily chart, Bitcoin’s 2026 range is projected at $75,526 to $97,000, with BTC trading near $85,500 in early October. The base-case target for October is $87,000, rising toward $92,000 by December if the 200-day EMA at $75,051 holds as structural support. A confirmed close below $75,051 would signal a macro trend failure.
2. What is the Bitcoin price prediction for 2026 by month?
Month-by-month BTC price base-case targets for the remainder of 2026 are $87,000 for October, $90,000 for November, and $92,000 for December. Each scenario assumes BTC defends its rising moving average based on pullbacks. Monthly targets adapt to macroeconomic liquidity, interest rate shifts, and spot ETF net flows.
3. What is the realistic Bitcoin price prediction for 2030?
A realistic 2030 price target for Bitcoin is $127,000, within a $119,000 to $136,000 range, which is roughly 49% above the current $85,500. By 2030, more than 20.5 million of the 21 million BTC cap will have been mined, slowing annual supply expansion to well under 1%. Actual valuations will depend on regulatory clarity, technological adoption, and global institutional demand.
4. How much will 1 Bitcoin be worth in 2030 in INR?
One Bitcoin is projected to reach approximately ₹1.22 crore in 2030, based on the $127,000 target and an exchange rate near ₹95.88 to the dollar. The broader $119,000 to $136,000 channel translates to roughly ₹1.14 crore to ₹1.30 crore, compared to approximately ₹81.98 lakh for BTC at $85,500 today.
5. What is the Bitcoin price prediction for 2027?
The 2027 target for BTC price is $100,000, within an $89,000 to $108,000 range, which is about 17% above the current $85,500. Achieving this milestone depends on BTC sustaining structural support above its 200-day EMA at $75,051, with post-halving structural scarcity acting as the primary macro driver.
6. What is the Bitcoin price prediction for 2040?
The 2040 target is $188,000, within a $165,000 to $210,000 range, roughly 120% above today’s $85,500. By 2040, more than 99% of the 21 million supplies will have been issued, leaving miners increasingly dependent on transaction fee revenue. Forecasts this far out are analytical scenario models rather than fixed price targets.
7. Is Bitcoin predicted to go up or down?
Bitcoin is predicted to go higher after a near-term pause. Price at $85,500 is consolidating below the $87,300 high, and RSI at 63.19 sits just beneath its 63.98 signal line, which points at range trade before the next attempt at a breakout. Price holds above all four moving averages and clears the 200-day EMA at $75,051 by 13.9%, keeping the medium-term uptrend protected.
8. Are Bitcoin price predictions on Reddit reliable?
Reddit is useful for gauging sentiment but should not be treated as financial advice, since posts rarely state an entry level, an invalidation point, or a timeframe. A more reliable approach is to cross-check community views against the chart, for example the 200-day EMA at $75,051 and the $82,281 breakout level, alongside RSI, volume and on-chain data before acting.
9. What factors influence Bitcoin price predictions?
The primary drivers influencing BTC price predictions include spot ETF inflows and outflows, institutional treasury allocations, macroeconomic interest rate policy, global liquidity conditions, and Bitcoin’s programmatic four-year halving cycle.
10. Is Bitcoin a good long-term investment?
Bitcoin suits market participants with a multi-year time horizon and high volatility tolerance. Its investment premise rests on fixed algorithmic scarcity, with over 20.06 million of the 21 million cap already mined. However, BTC has traded between roughly $57,000 and $96,000 during 2026, underscoring the importance of disciplined risk management.