This guide provides an Ethereum crypto price prediction using technical indicators such as the Relative Strength Index (RSI), exponential moving averages (EMAs), and volume profiles. Explore ETH price forecasts for today, this week, and the long term through 2040, along with key support and resistance levels, momentum analysis, and market outlook.
Ethereum (ETH) is currently trading near $2,697.6, down 0.44% after opening at $2,710.1 and fading from an intraday high of $2,724.2, as per the latest daily chart. The 14-day RSI has slipped to 59.71 from 61.61, widening the gap below its 14-day signal moving average at 62.29 to 2.58 points. Concurrently, the 20-day, 50-day, 100-day, and 200-day EMAs are positioned at $2,655.4, $2,500.2, $2,328.7, and $2,292.4, respectively.
The 100-day EMA now sits $36.3 above the 200-day EMA, extending the second golden cross from $29.0 at the last update and keeping all four primary daily moving averages in bullish sequence. With spot price trading just 1.6% above its ascending 20-day EMA, ETH is compressing between rising trend support at $2,655 and a supply zone that has now rejected three advances below $2,750.
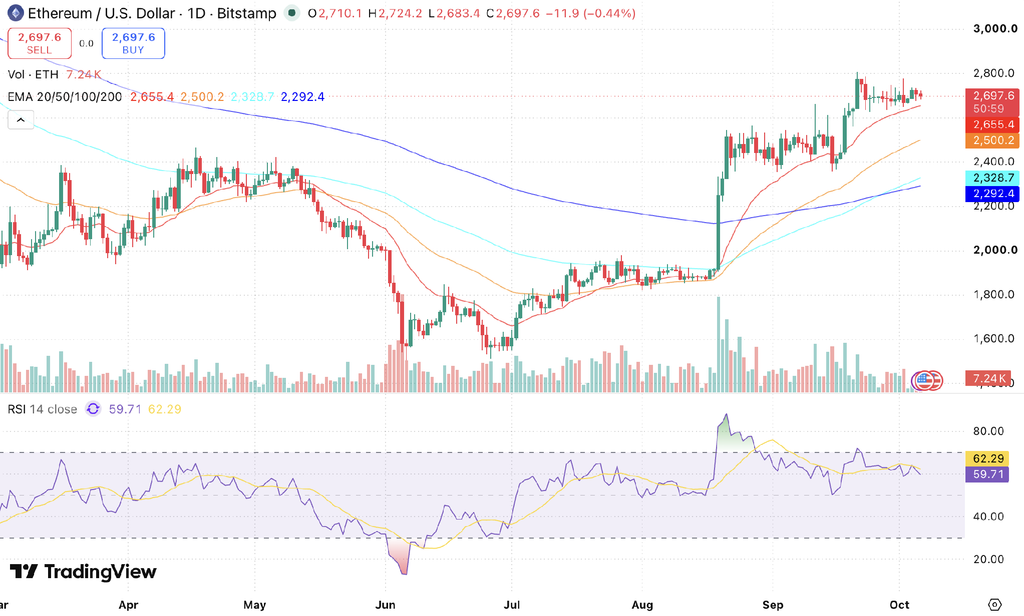
ETH/USD daily chart data sourced from TradingView
Key Insights
- Short-term outlook: ETH opened at $2,710.1, tagged $2,724.2, and faded to $2,697.6 in the lower half of a $40.8 daily range. Intermediate horizontal support rests at the session low of $2,683, followed by the 20-day EMA at $2,655.4, with $2,724 and the September 30 peak of $2,747.9 serving as the immediate overhead barriers.
- Medium to long-term outlook: The 100-day EMA at $2,328.7 has pulled $36.3 above the 200-day EMA at $2,292.4, extending from $29.0, confirming that the second golden cross is accelerating. The 50-day EMA at $2,500.2 sits $171.5 above the 100-day and $207.8 above the 200-day line, reinforcing multi-month trend support.
- Technical analysis: RSI has slipped to 59.7 from 61.6 and sits 2.6 points under its moving average at 62.3, the widest deficit of the current consolidation. Volume is 7.24K with the candle nearly complete, back near the pace that met the September 30 rejection.
Ethereum Short-Term Price Prediction – Today, This Week, October 2026
Here is the ETH price prediction 2026 for today, this week, and October 2026.
| Timeframe | Price Target | Support | Resistance | ROI |
|---|---|---|---|---|
| Next 24 Hrs | $2,724 | $2,683 | $2,748 | +0.98% |
| This Week | $2,750 | $2,655 | $2,800 | +1.94% |
| October 2026 | $2,950 | $2,655 | $3,100 | +9.36% |
Ethereum Price Prediction Today
Ethereum’s 24-hour price prediction is $2,724, about 1.0% above the current level. Ethereum trades near $2,697.6 after its push through $2,700 stalled at $2,724.2 and faded into the close, marking the third rejected advance below $2,750 since September 30. A confirmed daily close above $2,724 reopens $2,748, whereas a break beneath the session low of $2,683 points toward the ascending 20-day EMA at $2,655.4.
Ethereum Coin Price Prediction for This Week
The weekly forecast for ETH is $2,750, inside an expected channel of $2,655 to $2,800. The ceiling built by successive rejections at $2,722, $2,747.9, and now $2,724.2 remains active, meaning a daily close above $2,750 is required to confirm upside continuation. Primary dynamic support rests at the 20-day EMA at $2,655.4, which has advanced another $13.2 since the last update. A daily close below $2,655 would expose the 50-day EMA at $2,500.2.
| Read more: How to buy Ethereum in India |
Ethereum Price Prediction for October 2026
Ethereum’s October 2026 price is projected to reach $2,950, within a monthly range of $2,655 to $3,100. Reaching this objective requires a clean breakout above $2,800, which unlocks the $2,800 to $3,000 zone where February’s breakdown originated. The expanding 100-day golden cross, now $36.3 wide, provides an accelerating structural base. If $2,800 caps further rallies, October is projected to consolidate between $2,655 and $2,800.
Ethereum Coin Price Prediction for November 2026
November 2026 carries a $3,100 target, with a range of $2,750 to $3,300. This trajectory assumes October clears $2,950, as the monthly milestones stack sequentially. The ascending 50-day EMA ($2,500.2) must continue to climb to reinforce the macro trend. A November close below $2,750 would delay the sequence and push the $3,300 year-end target into 2027.
Ethereum Price Prediction 2026 (Medium Term)
| Month | Price Target | Support | Resistance | ROI |
|---|---|---|---|---|
| Oct 2026 | $2,950 | $2,655 | $3,100 | +9.36% |
| Nov 2026 | $3,100 | $2,750 | $3,300 | +14.92% |
| Dec 2026 | $3,300 | $2,900 | $3,500 | +22.33% |
Ethereum’s 2026 price range is projected at $2,655 to $3,300. The moving average structure keeps improving: the 50-day EMA at $2,500.2 is $171.5 above the 100-day EMA at $2,328.7, which has itself pulled $36.3 above the 200-day EMA at $2,292.4. The macro trend remains protected as spot price holds a 17.7% cushion above the 200-day line, with the 100-day EMA functioning as an intermediate structural cushion.
| Want to diversify beyond Ethereum? Check out the Top 10 Cryptos To Invest In 2026 |
Ethereum Price Prediction in INR (2026–2030)
For Indian traders, here is what the ETH price targets translate to in rupees.
| Period | ETH Target USD | ETH Price INR est. |
|---|---|---|
| October 2026 | $2,950 | ₹2,84,675 |
| December 2026 | $3,300 | ₹3,18,450 |
| 2027 | $3,600 | ₹3,47,400 |
| 2030 | $5,600 | ₹5,40,400 |
INR estimates based on a USD/INR rate of ~₹96.5. Rate fluctuations will affect actual INR values.
Ethereum Long-Term Price Outlook (2027–2040)
The long-term outlook for ETH rests on three structural drivers: continued dominance as the leading smart contract platform, the 2028 Bitcoin halving cycle’s indirect impact on the broader digital asset market, and institutional adoption through regulated ETF products.
The following forecasts are derived from network-adoption and Metcalfe-style models, broader Bitcoin halving-cycle analysis, and historical ETH volatility patterns. They represent scenario ranges, not price targets.
| Year | Price Target | Support | Resistance | ROI |
|---|---|---|---|---|
| 2027 | $3,600 | $2,900 | $4,200 | +33.45% |
| 2028 | $4,000 | $3,200 | $4,800 | +48.28% |
| 2029 | $4,800 | $3,800 | $5,600 | +77.94% |
| 2030 | $5,600 | $4,500 | $6,800 | +107.59% |
| 2031 | $6,200 | $5,000 | $7,500 | +129.83% |
| 2035 | $9,500 | $7,500 | $12,000 | +252.16% |
| 2040 | $14,000 | $11,000 | $18,000 | +418.98% |
Where Will Ethereum Price Go in 2030?
Ethereum’s 2030 price prediction targets $5,600, within a range of $4,500 to $6,800, supported by post-2028 halving liquidity expansion and institutional spot ETF adoption. Without a hard supply cap, Ethereum’s scarcity dynamics depend on net issuance: base-fee burning via EIP-1559 paired with high staking lockup ratios can produce flat or negative net supply during sustained network activity.
Where Will Ethereum Price Go in 2031?
The Ethereum price prediction for 2031 targets $6,200, with a range of $5,000 to $7,500, as the market enters the post-2028 cycle digestion phase. Cycle models anticipate 2031 serving as a consolidation period following cycle expansion. Staking participation rates, validator yield stability, and Layer-2 settlement throughput will serve as primary metrics to track.
Where Will Ethereum Price Go in 2040?
By 2040, Ethereum’s price is projected at $14,000, ranging from $11,000 to $18,000, as Ethereum’s issuance mechanics and network adoption mature further. Metcalfe’s Law and adoption-curve models point to $12,000-$18,000 under moderate adoption; more aggressive scenarios exceed $25,000. These forecasts carry high uncertainty and should be read as scenario ranges, not fixed targets.
Ethereum Technical Analysis
The following technical indicators were used to derive the Ethereum price prediction above.
| Indicator | Value | Signal |
|---|---|---|
| Relative Strength Index (14-Day RSI) | 59.71 | Falling, now below the 60 line |
| RSI Moving Average | 62.29 | RSI now 2.6 points below it |
| 20-Day EMA | $2,655.4 | Support, price 1.6% above |
| 50-Day EMA | $2,500.2 | Now $171.5 above the 100-day EMA |
| 100-Day EMA | $2,328.7 | Now $36.3 above the 200-day EMA |
| 200-Day EMA | $2,292.4 | Golden cross floor, price 17.7% above |
| Trading Volume, session to date | 7.24K ETH | Candle roughly 97% complete |
Relative Strength Index (RSI)
The 14-day RSI has slipped to 59.71 from 61.61, falling below the 60 line and widening the deficit to its signal moving average at 62.29 to 2.58 points. The spread had been narrowing at the last update; the rejection at $2,724.2 has reversed that improvement. Because the oscillator remains above the 50 neutral baseline, this still reflects consolidation rather than a trend breakdown, though momentum is softer than at any point since the September 30 rejection. Reclaiming 62.29 while price defends $2,655 would confirm renewed upward momentum, whereas a decline below 50 would expose the 50-day EMA at $2,500.2.
Exponential Moving Averages – 20-Day, 50-Day, 100-Day and 200-Day EMA
ETH trades above all four EMAs, sitting 1.6% above the 20-day EMA at $2,655.4, 7.9% above the 50-day EMA at $2,500.2, 15.8% above the 100-day EMA at $2,328.7, and 17.7% above the 200-day EMA at $2,292.4. The second golden cross has widened to $36.3 from $29.0, confirming that the 100-day line is pulling away from the 200-day EMA decisively. The spot price cushion over the 20-day EMA has compressed further to 1.6% from 2.1%, with the 20-day line climbing another $13.2 to $2,655.4. The squeeze between this rising support and the $2,724 to $2,748 supply zone tightens with each session, and the narrowing gap suggests the consolidation is approaching resolution.
Volume Analysis
Session volume sits at 7.24K ETH with the daily candle nearly complete, back near the 7.71K ETH printed during the September 30 rejection and several times the weekend turnover. The pattern is consistent: sellers expand activity whenever price presses the supply zone, and the latest surge turned the advance back from $2,724.2. Each rejection, however, is being absorbed well above the September 30 low of $2,651, keeping the sequence of higher lows intact. A confirmed daily close above $2,724 on sustained volume would signal overhead supply is thinning, while a close below $2,683 directs price toward dynamic support at $2,655.
What Is the Ethereum Price Prediction for Indian Traders?
ETH trades near ₹2,60,300 on CoinDCX in INR, with no USD conversion or international transfer required. Against the 2030 base case of ₹5,40,400, that is a potential 2.1x over four years. The Sepolia testnet fork activated on 6 October as scheduled, clearing the last milestone before the Glamsterdam mainnet deployment slated for Q4 2026. With that catalyst now priced in and three rejections standing below $2,750, staged entries carry less timing risk than a single purchase at these levels.
Disclaimer: This article is for informational purposes only and does not constitute financial or investment advice. Digital asset markets are highly volatile and prices can change rapidly. Past performance is not indicative of future results.
FAQs
Q1. Will Ethereum go up?
Ethereum will go up once it establishes a confirmed daily close above $2,700 and clears the supply zone capped by $2,748. Three advances have been rejected below $2,750 since September 30, most recently at $2,724.2. The 100-day EMA has expanded its lead over the 200-day to $36.3, so the trend structure supports a move, but the 14-day RSI at 59.71 has slipped below 60 and sits under its signal line, pointing to further consolidation before a decisive breakout.
Q2. What will 1 ETH be worth in 2030?
1 ETH will be worth around $5,600 in 2030, within a range of $4,500 to $6,800. Multi-year models project $9,500 by 2035 and $14,000 by 2040, subject to Layer-2 settlement adoption, staking lockup rates, and global network utility.
Q3. Is it better to buy Bitcoin or Ethereum?
Bitcoin and Ethereum serve distinct portfolio roles. Bitcoin functions primarily as a digital store of value with a hard supply limit of 21 million tokens. Ethereum serves as a decentralized computational layer powering smart contracts, DeFi ecosystems, and Layer-2 rollups, while offering native staking yields. Many investors maintain allocations to both assets for balanced diversification.
Q4. What is Ethereum's all-time high (ATH)?
Ethereum (ETH) reached its all-time high (ATH) of around $4,946 in August 2025, surpassing its previous record of $4,878 set in November 2021. Traders track this level as a primary macro reference for extended multi-year market cycles.
Q5. Is Ethereum dead?
No, Ethereum maintains its leadership in smart contract development, total value locked, and institutional product integration. The network continues to execute its technical roadmap, with the Glamsterdam hard fork scheduled for mainnet deployment in Q4 2026 following its Sepolia testnet debut on 6 October.
Q6. Is Ethereum a good investment in 2026?
Whether Ethereum is a good investment depends on entry timing more than trend direction. The base case puts ETH between $2,642 and $3,300 through the rest of the year. The second golden cross has widened, but RSI remains under its moving average and sellers turned price at $2,748. Staged entries reduce that risk.
Q7. How is Ethereum taxed in India?
Profits from selling ETH are taxed at a flat 30% plus 4% cess under Section 115BBH, whatever your slab or holding period. A 1% TDS applies under Section 194S, and losses cannot be set off or carried forward. Report each transaction in Schedule VDA. See our guide to crypto taxes in India for the full rules.
Q8. What is the Glamsterdam upgrade and will it push ETH higher?
Glamsterdam is Ethereum’s next major hard fork, planned for mainnet deployment in Q4 2026 after completing its Sepolia testnet rollout on 6 October. It introduces native proposer-builder separation and block-level access lists to support parallel execution and enhance transaction throughput.
Q9. Where can I buy Ethereum in India?
You can buy Ethereum in India on CoinDCX, directly in INR. There is no USD conversion, no international brokerage, and no currency risk from exchange rate moves. ETH is available for spot purchase and as a trading pair on India's FIU-IND registered digital asset exchange.