This Tron crypto price prediction explores TRX price targets from today and this week through 2026, 2030, and 2040. This Tron crypto price prediction explores TRX price targets from today and this week through 2026, 2030, and 2040. Analyze key support and resistance levels, Relative Strength Index (RSI) momentum, and exponential moving averages (EMAs) to evaluate potential short-term, medium-term, and long-term price trends across different market scenarios.
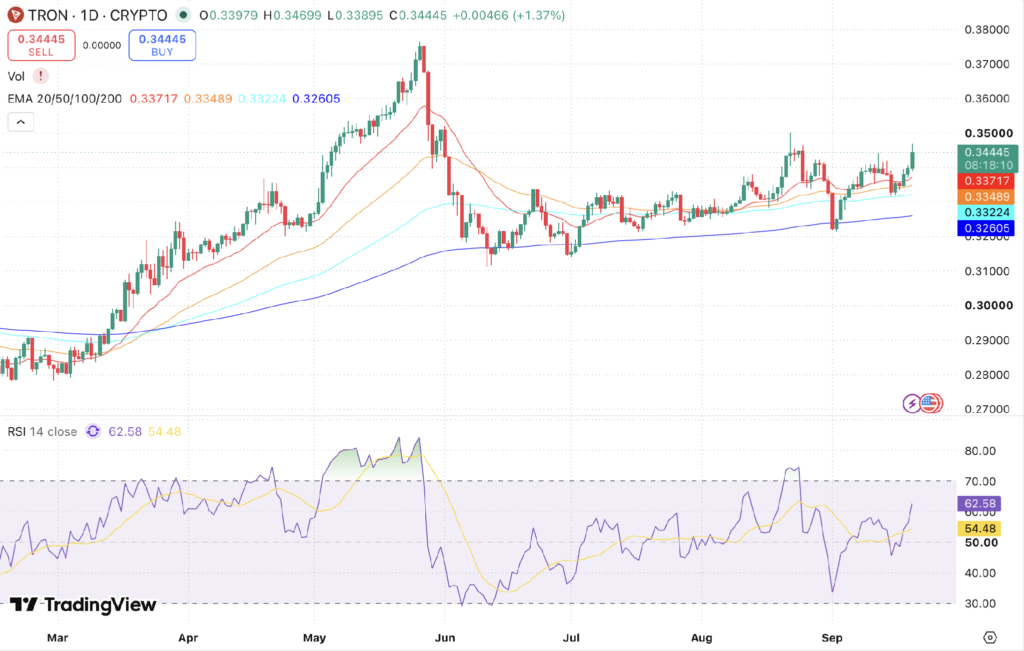
Currently, Tron (TRX) is trading at $0.34445, reflecting a bullish market posture as of September 21, 2026. The 14-day RSI has jumped to 62.58, reclaiming both the neutral 50 line and its signal average of 54.48. The 50-day and 200-day EMAs are positioned at approximately $0.33489 and $0.32605, respectively. Price has reclaimed the 20-day EMA at $0.33717 and touched an intraday high of $0.34699, registering its strongest print since the August peak. Based on these technical indicators and broader market trends, TRX is expected to defend dynamic support between $0.3372 and $0.3400 in the near term, with all four major moving averages positioned beneath spot price.
Key Insights
- This week: TRX price may hold between $0.3370 and $0.3570, with the $0.3349 fifty-day average the line that decides direction.
- September 2026: TRX targets $0.3570 through the rest of the month, with $0.3370 support and $0.3620 resistance framing the range.
- 2026: TRX is projected between $0.3370 and $0.3840 through 2026, with a year-end December target of $0.3760, provided the 20-day and 50-day EMAs now hold as dynamic support.
- 2030: Long-term price projections remain uncertain and depend on broader crypto-market cycles, TRON network adoption, and ecosystem growth rather than current technical indicators alone.
- Technical analysis: TRX has reclaimed all four of its EMAs and the RSI at 62.58 has crossed back above its signal at 54.48, so the mid-September pullback has been reversed outright.
Read how to execute your first TRX purchase on CoinDCX
Tron Short-Term Price Prediction – Today, This Week, September 2026
Here is the Tron coin price prediction 2026 for today, this week, and September 2026.
| Timeframe | Price Target | Support | Resistance | ROI |
|---|---|---|---|---|
| Next 24 Hrs | $0.3470 | $0.3400 | $0.3500 | +0.74% |
| This Week | $0.3520 | $0.3370 | $0.3570 | +2.19% |
| Sep 2026 | $0.3570 | $0.3370 | $0.3620 | +3.64% |
Trade TRX in INR on 
Deposit and withdraw in INR (₹).
No Conversion to Crypto Required.

Tron Price Prediction Today
The 24-hour target for TRON is $0.3470, with support at $0.3400 and resistance at $0.3500. The RSI at 62.58 has crossed back above its signal average at 54.48, and price is 2.16% above the 20-day EMA at $0.33717 after reclaiming that level. If TRX holds above $0.3400, $0.3500 comes into reach. If it slips below, the next support sits at $0.3372.
Tron Coin Price Prediction for This Week
The weekly target for Tron is $0.3520, with a $0.3370 to $0.3570 range for September 21 to 27, 2026. TRX is now 2.85% clear of the 50-day EMA at $0.33489, and the gap between the 20-day and the 50-day has widened back out, from $0.00167 to $0.00228. A weekly close above $0.3570 would put $0.3620 in play. A drop below $0.3370 would return $0.3322 to the frame.
Tron Price Prediction for September 2026
Tron’s September 2026 forecast targets $0.3570, with support at $0.3370 and resistance at $0.3620. Spot price sits 5.64% above its 200-day EMA at $0.32605, up from 2.69% in previous sessions as the reversal lifted price back through the entire moving average stack. Clearing $0.3570 before month-end would position TRX above its August high.
Tron Coin Price Prediction for October 2026
TRON’s October target sits at $0.3640, inside a $0.3500 to $0.3720 band. The 20-day and 50-day averages have separated again, to $0.00228 apart at $0.33717 and $0.33489, undoing the compression that formed during the mid-September pullback. A monthly close above $0.3720 would confirm renewed bullish momentum heading into the 2026 close.
Tron Price Prediction 2026 (Medium Term)
| Month | Price Target | Support | Resistance | ROI |
|---|---|---|---|---|
| Sep 2026 | $0.3570 | $0.3370 | $0.3620 | +3.64% |
| Oct 2026 | $0.3640 | $0.3500 | $0.3720 | +5.68% |
| Nov 2026 | $0.3700 | $0.3570 | $0.3780 | +7.42% |
| Dec 2026 | $0.3760 | $0.3630 | $0.3840 | +9.16% |
Tron’s 2026 price range is projected at $0.3370-$0.3840, based strictly on the price structure and technical levels visible in the provided charts. The 200-day EMA at approximately $0.32605 remains the key bull/bear line, and price now sits 5.64% clear of it, more than double the 2.69% cushion recorded a few sessions ago, which keeps the $0.3720-$0.3840 band in reach if the shorter averages hold on a retest. The available chart shows the 20-day, and 50-day spread widening back to $0.00228, with the RSI eight points above its signal line.
Tron Price Prediction in INR for Indian Traders
Converted at the live USD/INR rate of approximately ₹96.0, the key TRX levels for this cycle are as follows.
| Level | USD | INR |
|---|---|---|
| Current price | $0.34445 | ₹33.07 |
| Support | $0.3400 | ₹32.64 |
| Resistance | $0.3500 | ₹33.60 |
| Sep 2026 target | $0.3570 | ₹34.27 |
| Dec 2026 target | $0.3760 | ₹36.10 |
| 2030 target | $0.510 | ₹48.96 |
Note: INR values move with the exchange rate as well as the TRX price, so both should be checked against live figures.
Tron Price Prediction 2026 to 2040 (Long Term)
| Year | Price Target | Support | Resistance | ROI |
|---|---|---|---|---|
| 2027 | $0.385 | $0.360 | $0.410 | +11.77% |
| 2028 | $0.415 | $0.385 | $0.445 | +20.48% |
| 2029 | $0.455 | $0.415 | $0.495 | +32.09% |
| 2030 | $0.510 | $0.460 | $0.560 | +48.06% |
| 2031 | $0.550 | $0.490 | $0.610 | +59.67% |
| 2035 | $0.700 | $0.600 | $0.800 | +103.22% |
| 2040 | $1.000 | $0.800 | $1.200 | +190.32% |
Tron 2030 Forecast: What Is the Expected Price?
Tron price prediction 2030 targets $0.510, within a range of $0.460-$0.560, based on a long-term extrapolation of the price trend visible in the provided charts. Reaching that level would require network activity and the wider market cycle to keep expanding through at least one more full cycle, which matters far more to a four-year projection than any level on today’s chart.
Tron 2031 Outlook and Expected Price Range
The Tron price outlook for 2031 targets $0.550, with a range of $0.490-$0.610, assuming the long-term upward trajectory visible in the provided price history continues. A projection this far out rests on network usage and cycle timing rather than daily structure, so the range describes a path rather than a schedule.
Tron price prediction 2040: Long-Term Forecast
By 2040, Tron is projected to reach an average target of $1.000, with an estimated corridor of $0.800 to $1.200. Multi-decade projections rely heavily on the long-term utility of the TRON network and global settlement adoption. These estimates represent scenario-based models rather than exact price commitments.
Tron Technical Analysis
The following technical indicators were used to derive the price predictions above.
| Indicator | Value | Signal |
|---|---|---|
| Relative Strength Index (14-Day RSI) | 62.58 | Bullish |
| 50-Day EMA | $0.33489 | Bullish |
| 200-Day EMA | $0.32605 | Bullish |
Relative Strength Index (RSI)
The 14-day RSI is at 62.58, up roughly fourteen points from 48.13 a few sessions ago and back above both the 50 midline and its signal average at 54.48. The cross above the signal undoes the bearish crossover that formed during the pullback, and the speed of the turn points to buyers stepping in at the 50-day rather than to a slow drift higher. At 62.58, the reading is firm without being stretched, leaving about seven points of room before the 70 lines. The level to watch on a pullback is 54.48, where the signal line now sits.
Exponential Moving Averages (50-Day & 200-Day EMA)
TRX has reclaimed its 20-day EMA at $0.33717 and trades 2.85% above the 50-day at $0.33489, with the 100-day at $0.33224 and the 200-day at $0.32605 further below. Price sits 5.64% above the longer-term average, the widest cushion of the month, so the stack is back in bullish order with price clear of all four. The short end has reopened as well: the 20-day and 50-day have widened from $0.00167 to $0.00228 apart, reversing the compression of the previous week. The band at $0.33489 to $0.33717 is now the first support on any pullback.
Disclaimer: This article is for informational purposes only and does not constitute financial or investment advice. Crypto markets are highly volatile. Always do your own research (DYOR) before making any investment decisions.
FAQs
Q1. What will Tron be worth in 2026?
TRX is projected to trade between $0.3350 and $0.3770 through 2026, with a December target near $0.3690. The upper end of that range depends on TRX holding above its 200-day EMA at around $0.32464.
Q2. What will be the price of 1 TRX in 2030?
TRX is projected at around $0.510 in 2030, within a range of $0.460 to $0.560. That figure extends today's price trend forward by four years and assumes the wider crypto market keeps growing, so it is a scenario rather than a fixed target.
Q3. Will the Tron price ever hit $10?
It is very unlikely that TRX will ever hit $10. With around 94.9 billion tokens in circulation, a $10 price would put Tron's market capitalization near $950 billion, roughly 30 times the current $32.2 billion. The long-term forecast in this analysis reaches $1.000 by 2040, and TRX would have to gain another tenfold beyond that.
Q4. Is Tron a safe investment?
TRX can be considered a reasonably safe holding within the crypto market, provided the investor has researched the TRON network's fundamentals and studied how the price actually behaves. Early September made the risk plain, with TRX slipping under its 200-day EMA before reclaiming it and the rest of the stack inside a week.