This guide provides a Pi Network crypto price prediction using technical indicators such as the Relative Strength Index (RSI), exponential moving averages (EMAs), volume profiles, and key chart structures. Explore PI price forecasts for today, this week, and the long term through 2040, along with critical support and resistance levels, momentum analysis, and market outlooks. Whether tracking short-term price action or evaluating future potential, this forecast offers a data-driven view of Pi Network’s expected performance.
Pi Network (PI) is currently trading near $0.0828, beneath all four of its primary moving averages, as shown on the latest daily chart. The 14-day RSI stands at 39.79 against its 14-day moving average of 43.85, while the 20-day, 50-day, 100-day, and 200-day EMAs are positioned at $0.08636, $0.08933, $0.09763, and $0.12832, respectively. The daily session moved within a 1.83% range between $0.08219 and $0.08369 and is down 0.36%, with the intraday peak stalling 3.09% below the 20-day EMA.
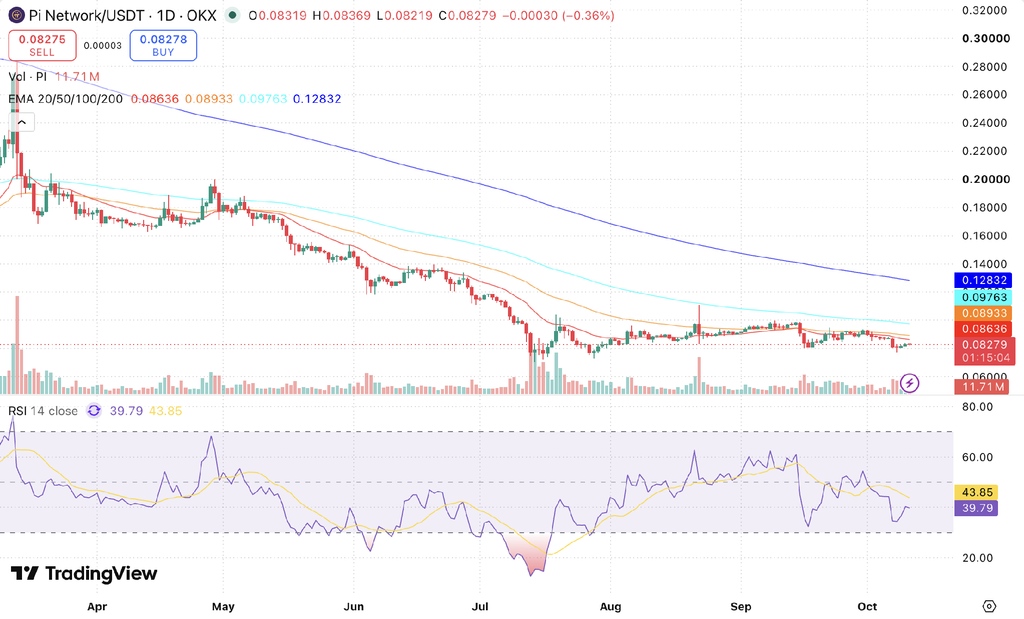
PI/USDT daily chart, Source: TradingView
Key Insights
- Short-term outlook: PI has rebounded off the $0.0800 floor and is consolidating following a 1.83% session between $0.08219 and $0.08369. The 20-day EMA at $0.08636 now sits 4.31% overhead, with the 50-day EMA at $0.08933 positioned 7.90% above price. The bounce has stalled near $0.0837, below the broken late-September floor, so a daily close above $0.0850 is the immediate requirement.
- Medium to long-term outlook: For the PI price prediction 2026, the gap to the 100-day EMA at $0.09763 stands at 17.92%, and that average continues to descend toward price. Reclaiming the 20-day EMA at $0.08636 on a daily close is the first prerequisite to test the 100-day line, while the descending 200-day EMA at $0.12832 serves as the macro ceiling above the December objective of $0.1100.
- Technical analysis: RSI at 39.8 sits 4.1 points below its moving average at 43.9, having recovered from a low near 34 and cut the bearish spread by nearly two-thirds. The 50-day EMA now sits 3.44% above the 20-day, up from 2.83%, so the bearish crossover is still widening. Volume at 11.71M is far below last week’s 42.58M dip-buying spike, so the rebound lacks conviction.
Pi Network Short-Term Price Prediction – Today, This Week, October 2026
Here is the PI price prediction for 2026 for today, this week, and October 2026.
| Timeframe | Price Target | Support | Resistance | ROI |
|---|---|---|---|---|
| Next 24 Hrs | $0.0835 | $0.0822 | $0.0850 | +0.86% |
| This Week | $0.0850 | $0.0800 | $0.0864 | +2.67% |
| October 2026 | $0.0864 | $0.0720 | $0.0976 | +4.36% |
Read more: How to buy Pi coin in India
Pi Network Price Prediction Today
PI is forecast to close today near $0.0835, holding within a $0.0822 to $0.0850 range. The late-September floor near $0.0850 remains the initial resistance after the rebound stalled near $0.0837, with the 20-day EMA at $0.08636 now positioned 4.31% overhead. The mid-September floor at $0.0800 held after last week’s test down to $0.07713, and a daily close below $0.0822 would put that floor back under pressure.
Pi Coin Price Prediction for This Week
This week, Pi Network is projected to reach $0.0850, inside an expected channel of $0.0800 to $0.0864. Reaching this objective requires the rebound to extend beyond the $0.0837 area, where the last two sessions have stalled. Reclaiming $0.0850 brings the 20-day EMA at $0.08636 back into view, while failing to recover it keeps price suppressed beneath resistance for a sixth consecutive week.
Pi Network Price Prediction for October 2026
Based on the descending 100-day EMA trend currently 17.92% overhead, PI is expected to trade between $0.0720 and $0.0976 in October, targeting $0.0864. This target depends on whether the $0.0800 floor holds long enough for price to stage a recovery back above the 20-day EMA at $0.08636. The mid-July low near $0.0720 serves as the structural base protecting the multi-month range.
Pi Coin Price Prediction for November 2026
By late November, PI may reach $0.0976, with support at $0.0864 and resistance at $0.1100. This trajectory assumes October successfully secures and defends the 20-day EMA, placing the 100-day line within range. The descending 200-day EMA at $0.12832 remains the overarching macro ceiling, while the August spike high near $0.1100 aligns with the year-end target.
Pi Network Price Prediction 2026 (Medium Term)
| Month | Price Target | Support | Resistance | ROI |
|---|---|---|---|---|
| Oct 2026 | $0.0864 | $0.0720 | $0.0976 | +4.36% |
| Nov 2026 | $0.0976 | $0.0864 | $0.1100 | +17.89% |
| Dec 2026 | $0.1100 | $0.0976 | $0.1283 | +32.87% |
Pi Network’s 2026 price range is estimated at $0.0720–$0.1100 based on the latest EMA structure. The 20-day EMA at $0.08636 now sits 4.31% above price, but the gap between the 20-day and the 50-day at $0.08933 has widened to 3.44% from 2.83%, indicating that the bearish moving average divergence is still deepening. The 200-day EMA at $0.12832 remains the major hurdle and caps the December target of $0.1100, which aligns with the August peak. Momentum has stabilized with the RSI recovering to 39.79 from its low near 34, while the $0.0800 floor continues to hold.
Want to diversify beyond Pi Network? Check out the Top 10 Cryptos To Invest In 2026 or our Ethereum Price Prediction
Pi Network Price Prediction in INR (2026–2030)
For Indian traders, here is what the PI price targets translate to in rupees.
| Period | PI Target USD | PI Price INR est. |
|---|---|---|
| October 2026 | $0.0864 | ₹8.24 |
| December 2026 | $0.1100 | ₹10.49 |
| 2027 | $0.18 | ₹17.17 |
| 2030 | $0.52 | ₹49.61 |
INR estimates use a USD/INR rate of approximately ₹95.40. Actual rupee values will move with the exchange rate.
Pi Network Long-Term Price Outlook (2027–2040)
The long-term outlook for PI rests on three structural drivers: the build-out of a usable app and DeFi ecosystem on the mainnet following the Protocol 27 upgrade, the pace at which locked and unmigrated supply is released into circulation, and whether the token secures broader regulated exchange access beyond its current listings.
The following forecasts are derived from network-adoption models, supply-release schedules, and historical PI volatility patterns. They represent scenario ranges, not price targets.
| Year | Price Target | Support | Resistance | ROI |
|---|---|---|---|---|
| 2027 | $0.18 | $0.09 | $0.32 | +117.42% |
| 2028 | $0.28 | $0.14 | $0.48 | +238.21% |
| 2029 | $0.40 | $0.20 | $0.66 | +383.15% |
| 2030 | $0.52 | $0.28 | $0.90 | +528.10% |
| 2031 | $0.60 | $0.32 | $1.05 | +624.73% |
| 2035 | $1.20 | $0.65 | $2.00 | +1349.45% |
| 2040 | $2.00 | $1.10 | $3.50 | +2315.75% |
Where Will Pi Network Price Go in 2030?
Pi Network could trade near $0.52 in 2030, within an estimated range of $0.28 to $0.90, assuming the migration overhang subsides and circulating float stabilizes. Long-term valuation models anticipate organic application usage, peer-to-peer commerce, and native DEX utility serving as the primary drivers of sustained demand.
Where Will Pi Network Price Go in 2031?
The 2031 outlook points to $0.60 for PI, with a range of $0.32 to $1.05, on the assumption that growth by then depends on real transaction volume rather than initial community onboarding. Cycle analysis models 2031 as a consolidation and base-building phase following the wider post-2028 crypto expansion. Growth during this stage will rely on verified on-chain transaction throughput.
Where Will Pi Network Price Go in 2040?
By 2040, Pi Network’s price is estimated at $2, ranging from $1.10 to $3.50, assuming the network sustains genuine utility over a fourteen-year horizon. Adoption-curve models suggest $1.50 to $3 under moderate growth, while aggressive scenarios would exceed $5. These forecasts carry very high uncertainty and should be read as scenario ranges, not fixed targets.
Pi Network Technical Analysis
The following technical indicators were used to derive the Pi Network price prediction above.
| Indicator | Value | Signal |
|---|---|---|
| Relative Strength Index (14-Day RSI) | 39.79 | Bearish, recovering from 34 low |
| RSI Moving Average | 43.85 | Bearish crossover, RSI 4.1 below |
| 20-Day EMA | $0.08636 | Resistance, 4.31% above price |
| 50-Day EMA | $0.08933 | Resistance, 7.90% above price |
| 100-Day EMA | $0.09763 | Medium-term resistance |
| 200-Day EMA | $0.12832 | Long-term resistance, still falling |
| Trading Volume | 11.71M PI | Partial session, thin rebound volume |
Relative Strength Index (RSI)
The 14-day RSI stands at 39.79, sitting 4.06 points below its signal moving average at 43.85. The negative spread has narrowed from 11.34 points last week as the oscillator recovered from a low near 34 without breaching the 30 oversold lines. The rebound reflects easing selling pressure, though the indicator remains below both its signal line and the 50 midlines. Crossing back above the signal line near 43.85 is required to confirm momentum stabilization.
Exponential Moving Averages – 20-Day, 50-Day, 100-Day and 200-Day EMA
The 20-day EMA at $0.08636 sits 4.31% above price, and the 50-day EMA at $0.08933 sits 7.90% above it. The session high of $0.08369 stalled 3.09% short of the 20-day line, and the rebound off the $0.07713 low has yet to retake the late-September base near $0.0850. The 50-day now sits 3.44% above the 20-day, expanding from 2.83% last week as the bearish crossover deepens. The 100-day EMA at $0.09763 and the 200-day EMA at $0.12832 remain on downward slopes, with the gap to the 100-day line standing at 17.92%.
Volume Analysis
Daily turnover stands at 11.71 million PI with just over an hour remaining in the session, well below the 42.58 million PI recorded during last week’s dip-buying session. The rebound off $0.0800 has come on thinning volume, indicating a relief bounce rather than fresh accumulation. Expanding volume on any attempt to reclaim $0.0850 and the 20-day EMA at $0.08636 will be necessary to transition this rebound into a durable recovery.
What Is the Pi Network Price Prediction for Indian Traders?
PI is not listed on CoinDCX, so Indian traders are tracking it on overseas venues priced in USD. At roughly ₹7.90 against the 2030 base case of ₹49.61, the long-term scenario implies a 6.3x move, though that rests on adoption assumptions rather than the technical picture above.
Disclaimer: This article is for informational purposes only and does not constitute financial or investment advice. Digital asset markets are highly volatile and prices can change rapidly. Past performance is not indicative of future results.
FAQs
Q1. What will Pi Network be worth in 2026?
Pi Network is expected to trade between $0.0720 and $0.1100 for the rest of 2026, with an expected year-end target of $0.1100. To reach higher targets, PI must first break above its 20-day EMA near $0.0864.
Q2. What will be the price of 1 PI in 2030?
The price of 1 PI may trade near $0.28 to $0.90 in 2030, with a base case of $0.52, depending on adoption and market conditions. That range assumes most locked supply has entered circulation by then, so demand rather than unlock pressure would determine price discovery.
Q3. Is Pi Network a safe investment in 2026?
Pi Network carries high technical risk in 2026. While it trades on several international spot platforms, it sits below all four of its key moving averages and remains well below historical launch highs. Because migrating tokens continue to enter the circulating float, market participants should manage exposure with strict position sizing.
Q4. What was Pi Network’s highest price?
Pi Network reached an all-time high of about $2.98 on February 26, 2025, right after open mainnet trading began. Strong initial demand drove that spike before the price entered a long consolidation phase.
Q5. What is the Pi Network price in India?
1 PI is worth roughly ₹8.01, based on current USD prices and an exchange rate of approximately ₹96.75 per USD. Because PI is not listed on domestic exchanges like CoinDCX, Indian investors track its value on international platforms.
Q6. What will be the Pi Network price in 2027?
By 2027, if Pi Network achieves stronger adoption and broader exchange listings, the price could range between $0.09 and $0.32, with a base case of $0.18, depending on market conditions and ecosystem growth. That base case implies roughly a 117% gain from current levels.
Q7. What is the Pi Coin price prediction for 2040?
Long-term models project PI between $1.10 and $3.50 by 2040, with an average target of $2.00. Forecasts this far out carry high uncertainty and depend entirely on sustained real-world usage.
Q8. Does Pi Network have a future?
Yes, Pi Network has future potential if it delivers on its technical roadmap. Its long-term viability depends on launching a functioning decentralized exchange, building active apps, and securing listings on major global exchanges.
Q9. How to sell Pi coins?
You can sell PI on international exchanges that support its spot trading pairs. Before selling, your tokens must be fully migrated from the mining app to your mainnet wallet with completed KYC verification.
Q10. Is Pi listed on CoinDCX?
No, Pi Network is not listed on CoinDCX. It cannot be bought or sold on the platform right now. CoinDCX is an FIU-IND registered exchange, and users should wait for official announcements regarding any future listing.