

This guide provides a Hyperliquid crypto price prediction using technical indicators such as the Relative Strength Index (RSI), moving averages, and on-chain metrics. Explore HYPE price forecasts for today, this week, and the long term through 2040, along with key support and resistance levels, momentum analysis, and market outlook. Whether tracking short-term price action or evaluating multi-year structural potential, this forecast offers a data-driven view of Hyperliquid’s expected trajectory.
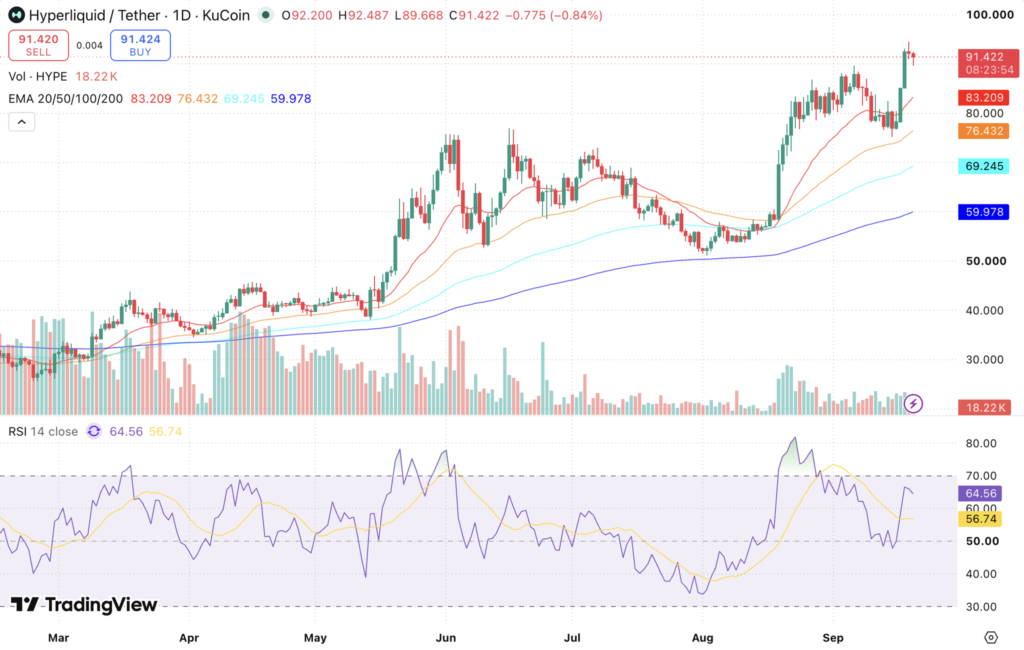
Hyperliquid (HYPE) trades near $91.42, sitting roughly 3.22% below its all-time high of $94.46 recorded on September 19, 2026, as per the latest daily chart. The 14-day RSI has climbed to 64.56, completing a bullish crossover above its 14-day signal average (56.74) to finalize the momentum reset that developed through the mid-September correction. The 20-day, 50-day, 100-day, and 200-day EMAs are positioned at $83.21, $76.43, $69.25, and $59.98, respectively. The daily session touched an intraday high of $92.49 before pulling back to test dynamic support near $89.67. With spot price holding 9.87% above its ascending 20-day EMA, HYPE is positioned to consolidate within the $89.67 to $94.46 corridor before attempting price discovery toward the psychological $100 milestone.
Key Insights
- Short-term outlook: HYPE sits 9.9% above the 20-day EMA at $83.21 and 52.4% above the 200-day at $59.98. The record at $94.46 is the level to clear, and the session low at $89.67 is the first support beneath price.
- Medium-Term Milestone: For year-end 2026, HYPE targets $120.00 within an expected channel of $78.00 to $135.00. Structural collateral utility has expanded following the launch of manual borrowing on September 18, enabling token holders to draw stablecoin liquidity against HYPE collateral without selling spot positions.
- Long-Term Trajectory: Multi-year performance through 2030 and 2040 depends on sustained leadership in decentralized perpetual trading, fee revenue growth relative to vesting token unlocks, and institutional adoption.
- Technical analysis: RSI at 64.56 has crossed above its moving average at 56.74, the first bullish cross since the August advance, and still sits below the 70 overbought lines. Under HIP-3, any entity deploying a market on Hyperliquid must stake 500,000 HYPE, worth roughly $46 million at current prices, which is structural demand rather than speculative flow.
Trade HYPE in INR on 
Deposit and withdraw in INR (₹).
No Conversion to Crypto Required.

Hyperliquid Short-Term Price Prediction – Today, This Week, September 2026
Here is the HYPE price prediction 2026 for today, this week, and September 2026.
| Timeframe | Price Target | Support | Resistance | ROI |
|---|---|---|---|---|
| Next 24 Hrs | $93.50 | $89.67 | $94.46 | +2.27% |
| This Week | $96.00 | $86.00 | $100.00 | +5.01% |
| September 2026 | $98.00 | $84.00 | $105.00 | +7.20% |
Hyperliquid Price Prediction Today
The HYPE forecast for the next 24 hours suggests that Hyperliquid could target $93.50 within the next day, with support at $89.67 and resistance at $94.46. HYPE is trading near $91.42, down 0.84% on the session, with the daily candle roughly two thirds complete. The token opened at $92.20, reached $92.49 and eased to $89.67 before recovering, a 3.1% range that is narrow by the standards of the past fortnight. Holding the low $90s after an 11% weekly gain is consolidation rather than rejection. A daily close above $94.46 restarts price discovery, while a break under $89.67 turns attention to $86.
Hyperliquid Coin Price Prediction for This Week
HYPE is projected to target $96.00 this week within an expected trading channel of $86.00 to $100.00. Establishing a daily close above $94.46 is the primary milestone to trigger a run toward the round $100 level. If overhead profit-taking caps the record high, the $86.00 shelf, built during the initial breakout, serves as primary horizontal support, with the 20-day EMA at $83.21 providing a trailing cushion.
Hyperliquid Price Prediction for September 2026
Hyperliquid’s September 2026 forecast targets $98.00, within a monthly corridor of $84.00 to $105.00. The month has produced multiple all-time highs, a token unlock absorption, and a 57% rolling 30-day gain. Collateral borrowing launched on September 18 at a 65% loan-to-value (LTV) limit, attracting roughly $269 million in stablecoin borrows on its first day. A monthly close above $98.00 puts triple-digit targets firmly in play, while a close below $84.00 would put the September breakout in question.
Hyperliquid Coin Price Prediction for October 2026
The October 2026 forecast targets $105.00, within an expected band of $82.00 to $115.00. A key fundamental driver landed on 3 October with the initial AQAv2 reserve-yield distribution, channeling USDC treasury yields into programmatic open-market HYPE repurchases. Under a 3% yield assumption, this mechanism injects roughly $182 million in annualized buyback power, providing structural buy-side demand alongside borrowing lockups and index tracking.
Hyperliquid Price Prediction 2026 (Medium Term)
| Month | Price Target | Support | Resistance | ROI |
|---|---|---|---|---|
| Sep 2026 | $98.00 | $84.00 | $105.00 | +7.20% |
| Oct 2026 | $105.00 | $82.00 | $115.00 | +14.85% |
| Nov 2026 | $112.00 | $80.00 | $125.00 | +22.51% |
| Dec 2026 | $120.00 | $78.00 | $135.00 | +31.26% |
Hyperliquid’s 2026 price range is projected at $78 to $135, raised from $68 to $120 after the record break. All four moving averages sit below price, and the 20-day EMA at $83.21 marks the level a normal retracement would target, roughly 9% beneath current price. Note that the support column widens as the months extend, which reflects falling confidence rather than an expectation of decline. The targets moved because the ceiling they were anchored to moved, and because borrowing against HYPE adds a use for the token that did not exist at the start of the month. HYPE remains one of the top web3 tokens to watch through the rest of the year.
Want to diversify beyond Hyperliquid? Check out the Top 10 Cryptos To Invest In 2026
Hyperliquid Price Prediction in INR (2026–2030)
For Indian traders, here is what the HYPE price targets translate to in rupees.
| Period | HYPE Target USD | HYPE Price INR est. |
|---|---|---|
| September 2026 | $98.00 | ₹9,339 |
| December 2026 | $120.00 | ₹11,436 |
| 2027 | $132.00 | ₹12,580 |
| 2030 | $192.00 | ₹18,298 |
Note: INR estimates based on a USD/INR rate of approximately ₹95.3 as of 21 September 2026. Rate fluctuations will affect actual INR values; verify at time of trade.
Hyperliquid Long-Term Price Outlook (2027–2040)
The long-term outlook for HYPE rests on three structural drivers: whether Hyperliquid defends its position as the dominant on-chain perpetuals venue, whether protocol fee revenue can reverse a four-quarter decline, and how the market absorbs an emission schedule that still has close to three-quarters of total supply to release. As a purpose-built Layer 1 blockchain, its fortunes are tied more directly to derivatives trading demand than a general-purpose network would be.
The following forecasts are derived from network-adoption and fee-multiple models alongside historical HYPE volatility. They represent scenario ranges, not price targets, and the ranges widen sharply in later years because confidence falls with distance. Long-dated crypto price targets have a poor accuracy record across the industry.
| Year | Price Target | Support | Resistance | ROI |
|---|---|---|---|---|
| 2027 | $132.00 | $68.00 | $198.00 | +44.39% |
| 2028 | $150.00 | $74.00 | $226.00 | +64.07% |
| 2029 | $168.00 | $80.00 | $260.00 | +83.76% |
| 2030 | $192.00 | $88.00 | $305.00 | +110.02% |
| 2031 | $218.00 | $95.00 | $352.00 | +138.45% |
| 2035 | $285.00 | $112.00 | $498.00 | +211.74% |
| 2040 | $360.00 | $125.00 | $680.00 | +293.78% |
Where Will Hyperliquid Price Go in 2030?
Hyperliquid’s 2030 projection targets $192.00, within a forecasted range of $88.00 to $305.00. Reaching the upper boundary requires Hyperliquid to defend its dominant market share in on-chain perpetuals, establish regulated US access, and scale protocol revenues faster than floating supply unlocks. The $88.00 support case models increased DEX competition and broader market consolidation. At $192.00, HYPE would trade at more than double its current valuation.
Where Will Hyperliquid Price Go in 2031?
The 2031 forecast targets $218.00, within an estimated range of $95.00 to $352.00. By 2031, most early token allocations will have completed their vesting schedules, mitigating unlock dilution. Token valuation will increasingly be driven by net fee-burn yield per circulating token and Assistance Fund balance sheet operations.
Where Will Hyperliquid Price Go in 2040?
By 2040, Hyperliquid’s price is projected at $360, ranging from $125 to $680. That is fourteen years out for a protocol that launched in late 2024, and the range is wide because almost nothing about the sector that far ahead can be pinned down. The figure assumes Hyperliquid is still one of the main venues for on-chain derivatives in the 2030s. Give far more weight to the near-term levels above, which come from the chart, than to this one.
Hyperliquid Technical Analysis
The following technical indicators were used to derive the Hyperliquid price prediction above.
| Indicator | Value | Signal |
|---|---|---|
| Relative Strength Index (14-Day RSI) | 64.56 | Crossed above its moving average, still below 70 |
| RSI Moving Average | 56.74 | Now beneath RSI after the bullish cross |
| 20-Day EMA | $83.21 | Support, price 9.9% above it |
| 50-Day EMA | $76.43 | Support, price 19.6% above it |
| 100-Day EMA | $69.25 | Support, price 32.0% above it |
| 200-Day EMA | $59.98 | Long-term support, still rising |
| Trading Volume | Session in progress | No daily total yet, breakout turnover the heaviest of the year |
Relative Strength Index (RSI)
The 14-day RSI has climbed to 64.56 from 55.51 and has crossed above its moving average at 56.74. That cross completes the momentum reset and is the first bullish signal this indicator has given since the August advance. At 64.56, the reading is firm without being overbought, which leaves room before the 70 line that marked the early-September peak. A drop back under 56.74 would undo it, while a push through 70 would signal the next leg has started.
Exponential Moving Averages – 20-Day, 50-Day, 100-Day and 200-Day EMA
HYPE is trading 9.9% above its 20-day EMA at $83.21, 19.6% above the 50-day at $76.43, 32.0% above the 100-day at $69.25, and 52.4% above the 200-day at $59.98. All four are rising and stacked in the right order, so the trend configuration is as clean as it has been all month. The 20-day line has turned sharply higher, gaining 4.2% in a handful of sessions as it catches up to price. A stretch of 9.9% above the short-term average is elevated but well short of the 14% reading that preceded the September correction. First support sits at $86, with the 20-day EMA at $83.21 beneath it.
Volume Analysis
The daily candle is roughly two-thirds complete, with about 18.22K HYPE traded, so there is no final figure yet. Turnover across the breakout sessions has been the heaviest of the year, with 24-hour volume passing $1.6 billion at the peak, which is the participation a record needs. Protocol activity is the fundamental anchor, with 97% of perpetual trading fees routed into buying back and burning HYPE and close to 48.7 million tokens removed from supply to date. Manual borrowing adds a second source of demand, with roughly $269 million drawn against HYPE and Bitcoin collateral on its first day. The figure to watch is whether volume returns on the next attempt at $94.46.
What Is the Hyperliquid Price Prediction for Indian Traders?
HYPE trades near ₹8,713, which puts the December 2026 target of $120 at roughly ₹11,436 and the 2030 base case of $192 at about ₹18,298.
The primary fundamental catalyst arrives on 3 October with the launch of AQAv2 yield distributions, adding consistent USDC-denominated buy pressure to the token. In India, HYPE is accessible on CoinDCX for direct spot trading in INR without foreign exchange conversion fees.
Disclaimer
This article is for informational purposes only and does not constitute financial, investment, or trading advice. Digital asset markets are subject to high volatility. Always conduct independent research before making trading decisions.
FAQs
Q1. What is the price of 1 HYPE coin today?
One HYPE coin is trading near $91.42, or approximately ₹8,713 at the prevailing exchange rate, as of 21 September 2026. The price moves continuously with market conditions, trading volume, and sentiment, so check live market data before acting on any figure.
Q2. What is the Hyperliquid price prediction for 2026?
The Hyperliquid price prediction for 2026 runs from roughly $78 to $135, with a December target of $120. HYPE set a record at $94.46 on 19 September and trades 3.2% below it, so the upper end depends on how the breakout holds rather than on whether it happens. The lower end reflects a scenario where the move fails, and price reverts toward its moving averages near $83.
Q3. How high can Hyperliquid (HYPE) go by 2030?
Hyperliquid could reach $305 by 2030 at the top of the scenario range, with a base case of $192 and a floor near $88. A four-year crypto price target carries low confidence and should be treated as illustrative rather than predictive.
Q4. What will Hyperliquid be worth in 2040?
Hyperliquid is projected at $360 by 2040, within a scenario range of $125 to $680. That is a fourteen-year horizon for a protocol launched in late 2024, so uncertainty is very high and the figure depends on Hyperliquid holding a significant share of on-chain derivatives volume across multiple market cycles.
Q5. Is HYPE crypto a good buy in 2026?
Whether HYPE is a good buy depends on an investor’s risk tolerance and market outlook. Hyperliquid has emerged as one of the leading decentralized perpetual trading platforms, and growing ecosystem adoption could support long-term demand for the HYPE token. However, like all cryptos, HYPE remains volatile and carries significant market risk.
Q6. Can Hyperliquid reach $100?
Hyperliquid needs a gain of roughly 9% to reach $100, a level that sits well below the December 2026 target of $120. HYPE traded as high as $94.46 on 19 September, so the path runs through that record first, and $100 would be the first round number in price discovery above it.
Q7. What is Hyperliquid’s all-time high?
Hyperliquid achieved an all-time high of $94.46 on 19 September 2026, surpassing its previous peak of $89.69 set on 7 September by 5.3%. Spot price currently consolidates roughly 3.2% below that high.
Q8. What factors affect the HYPE coin price?
Key price drivers include daily trading turnover, protocol fee burn rates, scheduled token unlock schedules, collateral borrowing demand, and institutional index tracking. Notably, HYPE’s inclusion in the Nasdaq CME Crypto Index at a 3.36% weighting provides structural institutional allocation.