
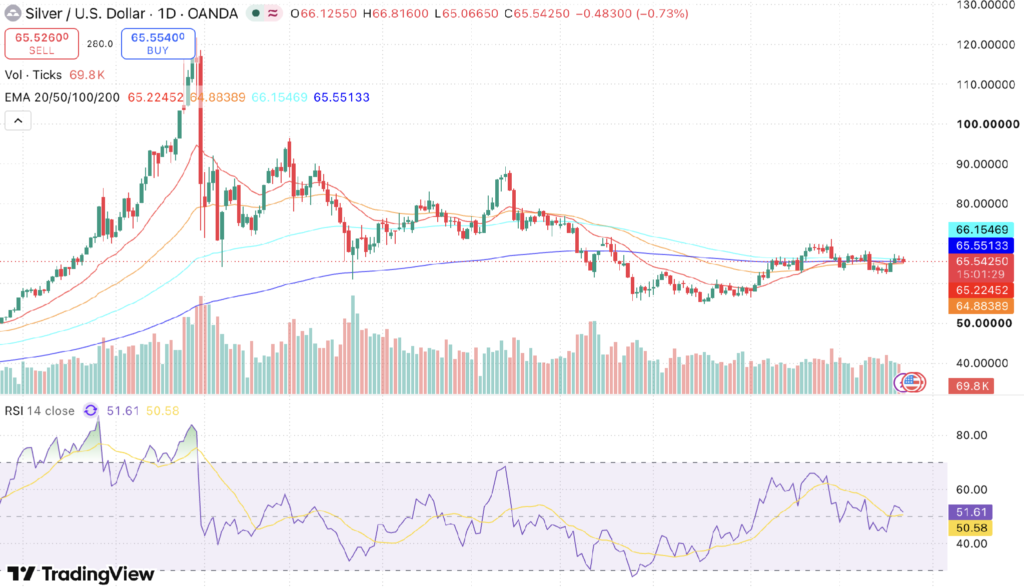
Silver is trading near $61.00 per troy ounce on 30 September 2026, pulling back from an intraday spike to $66.82, its highest print in over a week. Spot price holds above its 20- and 50-period exponential moving averages (EMAs) at $65.22 and $64.88 but converges directly with the 200-period EMA at $65.55 while remaining capped by the 100-period EMA at $66.15. This technical configuration indicates that while the short-term recovery off recent lows has progressed, the broader trend remains constrained below the 100-period moving average. Silver must clear the $66.15 to $66.82 supply band on daily closing volume to confirm a broader bullish continuation.
Silver Price Today: Live Snapshot
| Metric | Value on 30 September 2026 |
|---|---|
| Silver price (XAG/USD) | $61 |
| Day’s open | $66.13 |
| Day’s high | $66.82 |
| Day’s low | $65.07 |
| Immediate resistance | $65.55–$66.15 |
| Major resistance | $66.82, followed by $68 |
| Immediate support | $65.22 |
| Next support | $64.88, followed by $64.00 |
| RSI (14) | 51.61 |
| Short-term outlook | Neutral, holding just above the RSI signal line |
Prices and indicators are based on the daily (1D) XAG/USD chart on OANDA via TradingView, as of late September 2026. Silver prices can change rapidly during the session.
Why Is Silver Price Falling Today?
Silver has retreated to approximately $65.54 after testing $66.82 earlier in the session. The intraday pullback stems from hawkish commentary by Federal Reserve officials that reinforced expectations of prolonged monetary tightening, lifting the US dollar index and applying downward pressure on non-yielding commodities.
The Federal Reserve raised interest rates by 25 basis points at its 15–16 September meeting, its first hike since 2023, and has signalled it is not done tightening. Fed official Alberto Musalem said on 22 September that inflation could stay materially above the 2% target over the next 18 months without further rate increases, and markets are now pricing close to a 60% chance of another hike next month. The Bank of Japan has also raised rates to a 31-year high, adding to the tightening backdrop across major economies.
The US dollar remains firm on this repricing, which continues to cap silver’s upside even as falling oil prices and diplomatic efforts around the Middle East offer some support. Silver’s next move will depend on whether incoming Fed commentary confirms or walks back today’s hawkish tone.
Also read: How Rising Oil Prices Affect Crypto
Silver is above its 20- and 50-period EMAs but remains below the 100-period EMA and is essentially in line with the 200-period EMA. This means the recovery has advanced since last week, but the broader trend has not yet turned decisively bullish.
| Indicator | Value | Signal |
|---|---|---|
| 20-period EMA | $65.22 | Immediate support |
| 50-period EMA | $64.88 | Secondary support |
| 100-period EMA | $66.15 | Immediate resistance |
| 200-period EMA | $65.55 | Near-term pivot |
| RSI (14) | 51.61 | Neutral, holding above the signal line |
| RSI signal line | 50.58 | Momentum roughly flat |
| EMA structure | Above EMA 20 and 50; below EMA 100; at EMA 200 | Recovery has advanced but remains capped |
Indicator values are taken from the daily (1D) XAG/USD chart on OANDA (TradingView) on 22 September 2026.
Silver/USD, Source: TradingView
Silver trades approximately 0.49% above its 20-period EMA and 1.02% above its 50-period EMA. However, spot remains flat against its 200-period EMA at $65.55 and 0.92% below its 100-period EMA at $66.15. The $66.15 to $66.82 corridor represents the critical technical zone for buyers: a sustained close above $66.15 opens the pathway toward $68.00, whereas failure to clear this barrier leaves the metal vulnerable to retesting $65.22 and $64.88.
Silver Price Forecast for Today, Tomorrow and the Weeks Ahead
| Timeframe | Silver price outlook | Bullish trigger | Downside risk |
|---|---|---|---|
| Today | Pulling back below $66.15 after an early spike to $66.82 | Move above $66.15 | Fall below $65.22 |
| Tomorrow | Dependent on further Fed commentary | Break above $66.82 | Return below $64.88 |
| Next week | Range-bound unless $68 breaks | Sustained move above $68 | Break below $64.00 |
| Rest of September 2026 | Recovery remains capped below the 100-EMA | Hold above $66.15–$68 | Fall below $63.00 |
These levels are based on the daily XAG/USD chart supplied for 22 September 2026.
- Bullish scenario: A sustained move above the $66.15 resistance could take silver back toward $66.82 and then $68. If buyers also clear $68, the next resistance area lies between $70 and $72.
- Bearish scenario: If silver fails to reclaim $66.15 and falls below the 20-period EMA at $65.22, the price could slip toward $64.88. A break below the 50-period EMA and the $64 handle would weaken the recovery and signal renewed selling pressure.
Silver Price Forecast 2026: Full-Year Outlook
| Source | Figure | Versus current price | Type |
|---|---|---|---|
| Current silver price | $65.54 | Reference | Market price |
| J.P. Morgan, 2026 | $70.60 | +7.7% | Annual average |
| J.P. Morgan, Q4 2026 | $63.00 | −3.9% | Quarterly average |
| J.P. Morgan, 2027 | $63.90 | −2.5% | Annual average |
| Reuters analyst poll | $72.00 | +9.9% | Analyst average |
At approximately $65.54, silver is trading roughly 4% above J.P. Morgan’s $63 fourth-quarter forecast. However, it remains below the bank’s $70.60 full-year average and the Reuters poll figure of $72. This reflects the wide range of possible outcomes for the remainder of 2026.
Silver Price Forecast 2027 to 2030: Year-by-Year Outlook
Silver’s long-term direction will depend on investment demand, real interest rates, industrial consumption, mine supply, and recycling. The table below presents three CoinDCX scenario paths for XAG/USD rather than guaranteed price targets or analyst consensus.
| Year | Downside scenario | Base scenario | Upside scenario |
|---|---|---|---|
| 2027 | $50 to $65 | $65 to $75 | $85 to $95 |
| 2028 | $45 to $60 | $65 to $82 | $90 to $115 |
| 2029 | $45 to $60 | $70 to $90 | $105 to $135 |
| 2030 | $45 to $60 | $75 to $95 | $120 to $160 |
The base scenario assumes that silver-market deficits persist but that recycling, industrial substitution and slower photovoltaic demand limit the pace of price growth. The downside scenario assumes higher real interest rates, a stronger US dollar and faster industrial substitution. The upside scenario would require sustained investment inflows, tighter physical inventories and significant gold-to-silver ratio compression.
J.P. Morgan’s 2027 average of $63.90 sits inside the downside band above, below the $65 floor of the base case. Anyone weighing the two should treat this base case as contingent on the physical deficit reasserting itself rather than as a settled consensus view.
The 2027 range is informed by current published outlooks. WisdomTree expects silver to move toward approximately $70, while Citi sees a possible move to $95 but also assigns downside risk near $50. Estimates for 2028 through 2030 are CoinDCX scenario extensions and should not be presented as institutional forecasts.
Silver Price Forecast in India: MCX and INR Outlook
Indian silver prices are driven by international XAG/USD, the USD/INR rate, customs duty, GST, contract expiry and local premiums. India raised the effective customs duty on gold and silver from 6% to 15% in May 2026, and physical purchases can attract a further 3% GST. Futures and retail quotations follow different pricing conventions, so the same international price produces several different rupee numbers depending on which one you are looking at.
At the time of writing, the rupee is trading near ₹95.95 against the US dollar. On this basis, MCX December silver futures work out to approximately ₹2.32–2.39 lakh per kg on a duty- and GST-inclusive basis, and benchmark retail rates for 999-purity silver land in a similar band before local premiums and other charges. Final prices vary by city, seller and the live exchange rate.
How International Silver Converts to INR
A simplified estimate multiplies the international silver price by 32.1507 troy ounces per kilogram, the USD/INR exchange rate and the applicable duty and tax adjustments. Using a silver price of $65.54 and USD/INR near ₹95.95 gives an estimated duty-inclusive value of approximately ₹2.32 lakh per kg. After adding 3% GST, the indicative value is approximately ₹2.39 lakh per kg.
What the Key Levels Look Like in Rupees
| International level | Duty-inclusive estimate | After 3% GST |
|---|---|---|
| $64.00 | ₹2,27,000 | ₹2,33,900 |
| $64.88 | ₹2,30,200 | ₹2,37,100 |
| $65.07 | ₹2,30,800 | ₹2,37,800 |
| $65.22 (current support) | ₹2,31,400 | ₹2,38,300 |
| $65.54 (spot) | ₹2,32,500 | ₹2,39,500 |
| $66.15 (resistance) | ₹2,34,700 | ₹2,41,800 |
| $66.82 | ₹2,37,100 | ₹2,44,200 |
| $68.00 | ₹2,41,200 | ₹2,48,500 |
Conversions use USD/INR near ₹95.95 and are indicative only. Exchange rates, duties, GST, contract pricing and local premiums can change the final amount.
MCX Silver Contract Sizes
- Standard Silver futures: 30 kg
- Silver Mini futures: 5 kg
- Silver Micro futures: 1 kg
Leverage magnifies both gains and losses. MCX futures suit investors and hedgers who understand commodity derivatives, margin calls and contract expiry.
Gold-to-Silver Ratio: What It Means Now
With gold near $4,385 and silver around $65.54, the gold-to-silver ratio stands at approximately 66.9, up from about 65.7 earlier this week as silver underperformed gold on today’s hawkish Fed remarks. This means it takes about 67 ounces of silver to equal the value of one ounce of gold.
If gold remained near $4,385, a ratio of 70 would imply a silver price near $62.64. A ratio of 75 would imply approximately $58.47. The ratio can change because silver rises, gold falls, or the two metals move at different speeds. It should therefore be used alongside price trends, interest rates, industrial demand and investment flows.
Silver vs Gold: Which Is Better?
| Factor | Silver | Gold |
|---|---|---|
| Primary demand mix | Industrial plus investment demand | Investment, jewellery and central-bank demand |
| Volatility | Generally higher | Generally lower than silver |
| Industrial sensitivity | High | Limited |
| Drawdown from 2026 record | About 46.1% below the $121.64 January high | About 21.6% below the $5,597 January high |
| Relative valuation indicator | Gold-to-silver ratio near 66.9 | Reference asset in the ratio |
| Main risk | Demand destruction and large price swings | Real yields, dollar strength and weaker safe-haven demand |
Also read: Gold Price Forecast for 2026.
Is Silver a Good Investment Right Now?
Silver suits investors who understand how sharply it can move and who want exposure to both precious-metal and industrial demand.
Bull Case
- A sixth consecutive annual market deficit keeps the physical balance tight, and each successive deficit draws down above-ground stocks further.
- Silver remains about 46.1% below its January record of $121.64, which leaves considerable room for recovery if investment demand returns.
- AI data-centre build-out, electronics and electric vehicles may support longer-term industrial demand even as solar thrifting reduces the metal loading per panel.
- A pause or a less hawkish tone from the Fed after this month’s rate increase, or falling real yields, would improve the backdrop for the whole precious-metals complex.
Bear Case
- J.P. Morgan forecasts silver at $63.00 in the fourth quarter of 2026, which is below the current spot price, and cut its 2027 average by 25.5% in the same revision.
- Solar demand for silver is projected to fall by roughly 30% this year, a reduction of about 60 million ounces, as thrifting technologies spread and Chinese buyers work through inventory.
- The Federal Reserve delivered its first rate hike since 2023 on 16 September, and hawkish commentary from Fed officials since then has reinforced expectations of further tightening rather than the rate cuts markets had priced earlier in the year, which raises the cost of holding a non-yielding asset.
- Silver has already demonstrated that it can lose more than half its value from a speculative peak, and recycling supply tends to rise when prices are elevated.
Time horizon, liquidity needs, product costs, tax treatment and position size all matter more for silver than for lower-volatility holdings.
How to Invest in Silver in India
Silver is among the more accessible investments available to Indian investors, and the route chosen affects cost, liquidity and tax treatment as much as the price itself.
- Physical silver: Coins, bars and jewellery bought through jewellers, banks and government-linked mints. Investment-grade purity is standardised at 99.9%. This route carries 3% GST on purchase, making charges on jewellery and a storage requirement, so it suits investors who specifically want tangible ownership.
- Silver ETFs on NSE: Exchange-listed funds that hold vaulted physical silver and track the spot price. They trade like shares through a demat account, need no storage and remain the cleanest liquid option for most investors. Prices and NAVs move daily, so live market data should be checked before any decision.
- MCX futures: Standard 30 kg, mini 5 kg and micro 1 kg contracts, with leverage that amplifies both gains and losses. Appropriate only for investors comfortable with margin, expiry and daily mark-to-market.
- Digital silver: Fractional purchases stored in a vault on the investor’s behalf, available from as little as ₹1. Convenient for systematic, small-ticket accumulation without storage overhead.
For silver-linked market exposure without physical delivery, B-XAG/USDT Futures are available on CoinDCX, an FIU-IND registered platform.
Trade BTC & ETH in INR on 
Deposit and withdraw in INR (₹).
No Conversion to Crypto Required.

Disclaimer
This article is for informational and educational purposes only. It does not constitute financial, investment, or trading advice. Precious metal and digital asset markets involve significant risk. Please do your own research and consult a financial advisor before making any investment decisions.
FAQs
1. What is the silver price today in India?
As of late September 2026, MCX December 2026 silver futures work out to approximately ₹2.32 lakh and ₹2.39 lakh per kilogram, based on an international price near $65.54 per ounce and USD/INR near ₹95.95. Retail 999-purity rates run close to this range before local premiums. Check a live MCX quote for the exact intraday figure.
2. Why did silver price fall in 2026?
Silver fell roughly 44% from its January 2026 all-time high of $121.64 per ounce due to three main factors: the CME Group raised margin requirements on silver futures, forcing leveraged traders to sell; the US dollar strengthened significantly as the Federal Reserve signalled it would not cut rates soon; and profit-taking after silver's extraordinary 147% rally in 2025 created a natural correction.
3. Will silver price increase in 2026?
Silver could resume an upward trajectory if price establishes a confirmed daily close above the $66.15 to $66.82 resistance cluster. Institutional targets remain divided, with J.P. Morgan forecasting a fourth-quarter average near $63.00, while consensus analyst polls project full-year targets near $70.60 to $72.00.
4. What is the silver price forecast for 2030?
CoinDCX's scenario framework puts 2030 silver in a range of roughly $45 to $160 per ounce (approximately ₹1.64 lakh to ₹5.85 lakh per kg in India), with the spread driven by structural supply deficits, solar and EV demand, and the broader interest-rate cycle. These are long-range scenarios, not consensus forecasts, and carry significant uncertainty.
5. Is silver better than gold right now?
Silver is underperforming gold today: it has pulled back from a one-week high near $66.82, and the gold-to-silver ratio has risen to approximately 66.9 from about 65.7 earlier this week. Silver remains roughly 46% below its all-time high versus gold's roughly 22% below its own, which leaves more room for a silver recovery on a purely mathematical basis. Silver is considerably more volatile, so gold remains the steadier holding.
6. How does oil price affect silver?
High oil prices increase inflation, which reduces the likelihood of Federal Reserve rate cuts. High rates strengthen the US dollar, which makes silver more expensive for non-dollar buyers and reduces global demand. This is the indirect mechanism through which oil at $100+ puts pressure on silver prices in the short term. Paradoxically, the geopolitical events causing high oil (Middle East conflict) also drive safe-haven demand for silver, creating a tug-of-war effect that increases volatility.
7. What will be silver price prediction for the next 5 years?
CoinDCX's scenario framework projects silver trading between roughly $45 and $160 per ounce over the next five years (approximately ₹1.64 lakh to ₹5.85 lakh per kg in India). This wide range is driven by persistent supply deficits, the green energy transition (solar and EV demand), and fluctuating US Federal Reserve policy.
8. Will silver reach ₹5 lakh per kg?
Silver would need to roughly double from its current Indian price of approximately ₹2.32–2.39 lakh per kg to reach ₹5 lakh per kg. This is not part of the current base-case forecast and would likely require a substantial rise in international silver prices, further rupee weakness, or higher taxes and premiums.
9. What is the silver MCX price prediction for the rest of 2026?
If international silver holds above $66.15 and moves toward the $70 to $75 zone, MCX-equivalent pricing works out to approximately ₹2.56 lakh to ₹2.74 lakh per kg at the current rupee level and duty structure. A failure at $66.15 that sends the spot back to $63.00 would put MCX pricing closer to ₹2.30 lakh per kg. Any silver MCX price prediction should be re-run whenever USD/INR or import duty changes.