


Today, Gold is trading near $4,139 per ounce, decreasing after massive multi-month surge and record highs earlier in 2026. Technically, the asset has entered consolidation and correction phase.
For the week of October 21–28, 2026, the gold price prediction range is $4,000 to $4,280 per ounce ahead of upcoming Federal Reserve meeting on October 27–28. Gold must recover above $4,289 to re-establish bullish momentum, while a sustained break below $4,050 exposes the $3,950 level, last tested earlier in the year.
Gold Price Today in India and Global Markets
| Market | October 2026 |
|---|---|
| Spot gold/XAU/USD | Around $4,139 per ounce |
| Immediate support | $4,100–$4,125 |
| Major support | $4,050 |
| Deeper support | $3,950 |
| Immediate resistance | $4,157 |
| Major resistance | $4,194–$4,289 |
| MCX gold futures | Around ₹1.46 lakh per 10 grams |
| Retail 24K gold | Approximately ₹1.47 lakh–₹1.50 lakh per 10 grams |
| Broader weekly XAU/USD range | $3,950–$4,500 |
Spot values read from the four-hour XAU/USD chart during the IST afternoon session on 21 October 2026, with the four-hour candle still open at the time of writing. Indian physical prices vary with GST, city, dealer margins and jewellery-making charges.
Gold Price Technical Analysis
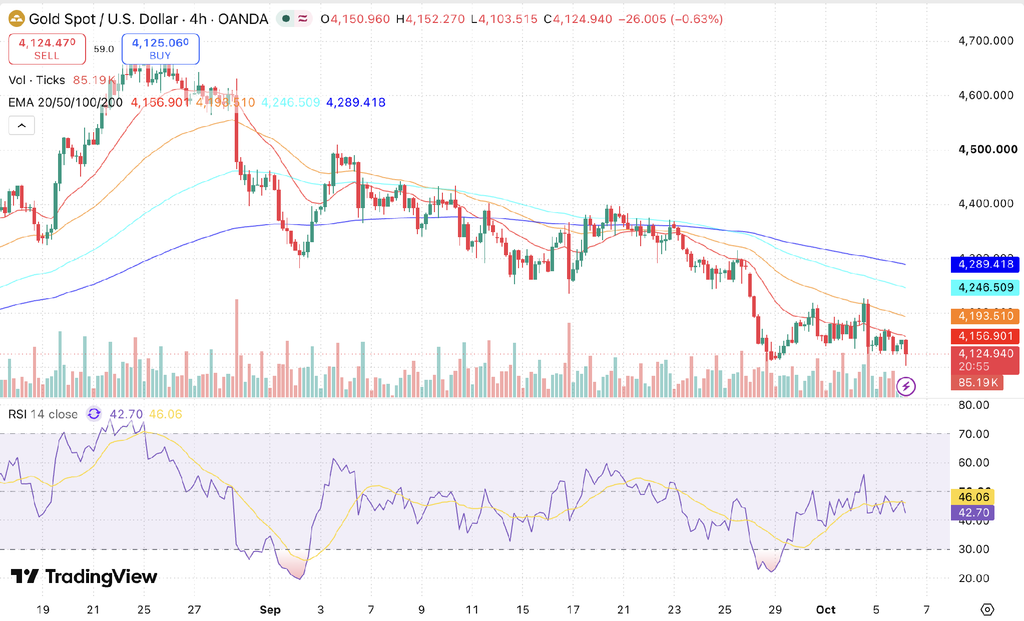
The four-hour gold chart shows a clear bearish EMA staircase. Gold is trading around $4,125, below all four exponential moving averages shown on the chart. The 20-period EMA at approximately $4,157 acts as the first dynamic barrier. Above it, the 50-period EMA near $4,194 and the 100-period EMA near $4,247 form the middle of the resistance ladder, with the 200-period EMA near $4,289 defining the ceiling of the supply band, now roughly 4% above spot. Gold requires a decisive recovery through this cluster to validate a technical trend reversal.
| Indicator | Current reading | Signal |
|---|---|---|
| Gold price | Around $4,125 | Below all four EMAs |
| 20-period EMA | $4,156.90 | Immediate resistance |
| 50-period EMA | $4,193.51 | Part of resistance cluster |
| 100-period EMA | $4,246.51 | Part of resistance cluster |
| 200-period EMA | $4,289.42 | Major recovery threshold |
| RSI (14) | 42.70 | Below its own signal line, in bearish territory |
| RSI signal (MA) | 46.06 | Bearish momentum, not yet oversold |
Indicator values read from the four-hour XAU/USD chart on 6 October 2026. The four-hour candle was still open at the time of writing.
Source: TradingView
The RSI has fallen to 42.70, below its 46.06 signal average and below the neutral 50 mark, reflecting the broader bearish structure, though it is not yet close to oversold territory. After spiking into oversold near 20 in late September and recovering sharply above 55 in early October, momentum has rolled back lower as the latest leg of the decline resumed, consistent with price breaking through the $4,230 support that previously capped the decline. A confirmed reversal would still require gold to reclaim the $4,194–$4,289 resistance area.
Is Gold Bullish or Bearish?
Gold’s short-term technical structure has turned decisively bearish. Price is compressed well below all four EMAs on the four-hour timeframe, and momentum oscillators continue to print below their signal averages with no sign of basing yet. The $4,230 level that previously capped the decline has now been broken, and gold is testing the $4,100–$4,125 zone directly. A four-hour close above $4,157 would provide an initial signal of stabilization, followed by a necessary clearance of the $4,194 to $4,289 cluster to shift the near-term bias to neutral. Failing to hold $4,100 leaves $4,050 and $3,950 vulnerable to retests.
The pressure driving this decline traces back to two live central-bank decisions in mid-September rather than anticipation of them. The Federal Reserve raised its target range by 25 basis points to 3.75% – 4.00% on September 16, its first hike since 2023, and 16 of 18 officials pencilled in at least one more increase before year-end. The Bank of Japan followed on September 18 with its own 25-basis-point hike, taking its policy rate to 1.25%, a 31-year high. Three weeks on, gold has not found a floor, and markets still price in roughly a 50–60% chance of a further Fed move at the upcoming October 28 meeting.
Oil and gold are trading off related rate and inflation catalysts. For the energy side of that trade, see the Crude Oil Price Prediction.
Gold Price Forecast for Next Week
The gold price forecast for the week of October 6–11 remains event-driven, with a primary expected range of $4,050–$4,289. The chart maintains a firmly bearish bias below $4,289, and unlike the prior update there is no bounce yet to suggest consolidation before the next move.
| Level | XAU/USD zone | Significance |
|---|---|---|
| Broader event-risk resistance | $4,480–$4,500 | August–September swing-high zone |
| Major resistance | $4,194–$4,289 | 50-period to 200-period EMA cluster |
| First recovery zone | $4,157–$4,194 | 20-period and 50-period EMAs |
| Current reference price | Around $4,125 | Latest four-hour chart |
| Immediate support | $4,100–$4,125 | Today’s session low |
| Major support | $4,050 | Prior support zone, now broken |
| Event-risk support | $3,950 | Next psychological level on a sustained breakdown |
Bullish scenario: A sustained four-hour close above $4,157 could allow gold to test $4,194–$4,289. Clearing $4,289 would strengthen the recovery and place $4,480–$4,500 in focus. The longer-term $4,769 level remains distant and would only become relevant after gold rebuilds through these nearer resistance zones.
Bearish scenario: Failure to recover above $4,157 would keep the downtrend intact. A break below $4,100 could extend losses towards $4,050, while a decisive loss of $4,050 would expose the $3,950 level.
With the Fed and BOJ decisions now three weeks behind the market, the focus has shifted to incoming US economic data, Treasury yields, the dollar, and Fed commentary on the odds of a move at the October 28 meeting as the key drivers for the week.
Will Gold Fall Today?
Gold remains vulnerable to further declines while trading well below the $4,194–$4,289 resistance area. The price is below all four major EMAs, and the RSI at 42.70 reflects bearish momentum without yet reaching oversold territory, keeping the immediate technical bias firmly bearish.
Today’s session has extended the slide rather than reversed it, opening at $4,150.96 and printing an intraday low of $4,103.52 before settling near $4,124.94, down 0.63% on the day. A break below $4,100 could bring $4,050 and $3,950 into focus, whereas a recovery above $4,157 would be the first sign the bearish case is weakening.
Is Now a Good Time to Buy Gold?
There is no single right time to buy gold. The decision depends on the purpose of the purchase, the holding period and the ability to absorb price declines. A short-term gold price forecast cannot establish whether a purchase suits an individual.
Physical gold, gold ETFs, tokenised gold and gold futures carry different costs and risks. Physical purchases can involve storage costs and making charges, while tokenised products introduce issuer and custody risks. Leveraged perpetual futures can result in rapid losses or liquidation and do not provide ownership of physical gold.
Gold Price Forecast 2026: What Analysts Expect
At one end, J.P. Morgan Global Research expects gold to average $6,000 an ounce in the fourth quarter. At the other, the late-July Reuters poll and the London Bullion Market Association mid-year survey both land near $4,500.
| Source | Figure | Versus approximately $4,125 | Type of number |
|---|---|---|---|
| Current spot | $4,125 | Reference | Latest chart |
| J.P. Morgan, Q4 2026 | $6,000 | +45.5% | Quarterly average |
| J.P. Morgan, 2026 | $5,243 | +27.1% | Annual average |
| LBMA most bullish | $5,100 | +23.6% | Year-end survey figure |
| Goldman Sachs | $4,900 | +18.8% | Year-end target |
| Reuters analyst poll | $4,509 | +9.3% | Median of 29 analysts |
| LBMA mid-year survey | $4,500 | +9.1% | Survey average |
Two features of the table matter more than any individual gold price prediction:
1. Gold has fallen further below the $4,500–$4,509 broad-survey range than in the prior update, as the decline since the Fed and BOJ hikes has continued rather than stabilized.
2. Institutional estimates remain widely dispersed, from approximately $4,500 to $6,000, reflecting substantial uncertainty around further Fed and BOJ policy moves, inflation, yields and investment demand.
CoinDCX view: The latest chart is more cautious than the institutional year-end forecasts. Gold must first reclaim the $4,194–$4,289 resistance cluster before the higher $4,500, $4,769 and $4,900 targets become technically relevant. A break below $4,050 would instead increase the risk of a move towards $3,950.
Source: J.P. Morgan Global Research gold price forecast.
Gold Rate Forecast in India (2026)
At current international and MCX reference levels, the near-term gold rate forecast in India remains approximately ₹1.40 lakh–₹1.59 lakh per 10 grams. The range accounts for the broader $3,950–$4,500 international scenario, although the actual Indian gold price will also depend on USD/INR, the relevant MCX contract, import duty and domestic premiums.
| International level | Indicative MCX-equivalent zone | Significance |
|---|---|---|
| $3,950 | Around ₹1.40 lakh | Deeper downside level |
| $4,050 | Around ₹1.43 lakh | Major support |
| $4,100 | Around ₹1.45 lakh | Immediate support area |
| $4,157 | Around ₹1.47 lakh | First resistance |
| $4,289 | Around ₹1.52 lakh | Resistance cluster ceiling |
| $4,500 | Around ₹1.59 lakh | Upside extension |
Conversions use a USD/INR rate of approximately ₹95.4 and a 15% customs duty, and exclude GST, dealer premium, and making charges. Any change in the rupee or the duty structure moves every figure in this table, so the calculation should be re-run rather than carried forward.
Gold Price Prediction 2027 to 2031: Long-Term Outlook
The long-term price outlook for gold rests on central bank demand. The World Gold Council 2026 survey found that 89% of reserve managers expect global central bank gold holdings to rise over the next 12 months, and a record 45% plan to add to their own reserves. Central banks accumulated an average of about 1,000 tonnes a year over the past four years, roughly double the pace of the prior decade.
Complicating the situation in 2026, central banks sold 129 tonnes in the first quarter, led by a 60-tonne disposal from Turkey, and net reported purchases came to just 16 tonnes. Using London over-the-counter data and Swiss refinery flows, the World Gold Council estimates actual first-quarter buying was closer to 244 tonnes, up from 208 tonnes in the final quarter of 2025. Chinese net imports reached 317 tonnes in the first quarter, close to three times the previous quarter, and the People’s Bank of China lifted reported purchases from roughly one tonne a month to five tonnes in March and eight in April.
| Year | Conservative | Base case | Bullish case |
|---|---|---|---|
| 2026 (year-end) | $4,400 | $4,900 | $6,000 |
| 2027 | $4,000 | $4,800 | $6,300 |
| 2028 | $4,400 | $5,300 | $7,000 |
| 2029 | $4,800 | $5,900 | $7,800 |
| 2030 | $5,200 | $6,500 | $8,600 |
| 2031 | $5,600 | $7,100 | $9,500 |
The 2026 year-end row is anchored to published targets: the conservative figure is the Goldman Sachs scenario for a Fed that hikes further, the base case is the Goldman year-end target, and the bullish figure is the J.P. Morgan Q4 2026 forecast. The 2027 bullish figure is J.P. Morgan’s published 2027 target. Rows from 2028 onward are scenario extrapolations anchored to those institutional ranges rather than published forecasts, and they illustrate trajectories rather than guarantees.
The conservative column broadly describes a world in which the Fed keeps hiking through 2027; the bullish column describes one in which it pivots and central bank accumulation reaccelerates.
Considering investing in silver? Check out our Silver Price Forecast.
Factors That Could Affect Gold Prices
Federal Reserve policy and real interest rates: The Fed’s first hike since 2023 lifted the target range to 3.75%–4.00% on September 16, and 16 of 18 officials still see room for one more move this year. Higher real yields raise the opportunity cost of holding an asset that pays nothing, which remains the single largest swing factor in every forecast above.
The US dollar: A weaker dollar makes gold cheaper for buyers outside the United States. The dollar’s strength since the Fed and BOJ decisions continues to weigh on gold, and remains the main headwind behind the metal’s slide into early October.
Oil and inflation: Expensive energy can support gold as an inflation hedge, but it also raises rate expectations, which works against it. A sharp drop in crude after the Fed decision helped gold’s brief rebound in late September, though that bounce has since faded, showing how quickly the two effects can offset each other.
Central bank and ETF demand: Sustained official-sector buying absorbs supply and sets a floor, while ETF outflows can amplify corrections when investor sentiment turns.
Geopolitical risk: Conflict lifts safe-haven demand, though the effect is often offset when the same conflict drives energy prices and yields higher.
India-specific factors: The rupee, the 15% import duty, GST, festive and wedding demand, and dealer discounts all move the local price independently of the international one.
Physical Gold vs Tokenised Gold: XAU-USDT and PAXG on CoinDCX
Indian investors can take gold exposure through physical metal, gold ETFs, MCX futures or tokenised gold. Each carries a different ownership profile, and the differences matter more than they appear at first glance.
| Feature | Physical gold | MCX futures | Tokenised gold |
|---|---|---|---|
| Trading hours | Store hours | Fixed sessions | 24/7 |
| Minimum ticket | High | Lot-based | Fractional |
| Storage | Custody needed | Not applicable | No custody needed |
| Backing | Physical metal | Exchange contract | Varies by product |
PAX Gold is a token backed by allocated physical gold held by its issuer, so its price tracks spot gold closely. XAU-USDT and PAXG-USDT are perpetual futures pairs that track the gold price with leverage available, and they do not convey ownership of physical metal. Both trade around the clock on CoinDCX, an FIU-IND registered platform, which matters because the largest gold moves increasingly happen during US market hours when Indian exchanges are closed.
For portfolio context beyond precious metals, see the Bitcoin Price Prediction, and if you are new to the platform, here is how to buy crypto in India.
Gold Price History (2010 to 2024)
Gold has delivered steady long-term growth across decades, which reflects its role as a store of value rather than a fast-moving asset. Periods of economic expansion often bring temporary corrections, because investors rotate toward riskier assets during recoveries.
Major global crises usually push gold higher, since financial stress increases demand for safe-haven assets. Recessions and pandemics have repeatedly highlighted that defensive quality, and over long periods gold has preserved purchasing power effectively.
| Year | Average gold price (USD per ounce) |
|---|---|
| 2010 | 1,224 |
| 2012 | 1,668 |
| 2015 | 1,160 |
| 2018 | 1,268 |
| 2020 | 1,770 |
| 2021 | 1,799 |
| 2022 | 1,800 |
| 2023 | 1,940 |
| 2024 | 2,050 |
Quick insight from history: The table shows gradual long-term growth with regular short-term swings along the way. The move from an average of roughly $2,050 in 2024 to around $4,125 in October 2026 remains significantly steeper than the growth seen across much of the previous fifteen-year period. That rapid appreciation should be considered when assessing higher long-term gold price forecasts.
Conclusion
Gold may remain volatile during the week of October 6–11, with $4,050–$4,100 providing the key support zone and $4,157–$4,289 forming the immediate resistance area. With the initial Fed and BOJ reaction now three weeks behind the market and the downtrend still intact, the next move will likely depend on incoming US economic data, Fed commentary on the odds of an October 28 hike, Treasury yields, the dollar and geopolitical developments. Traders should treat these levels as conditional scenarios rather than assured price targets.
Disclaimer
This article is for informational purposes only and does not constitute investment advice. Gold, crypto assets and derivatives can be volatile. Commodity-linked perpetual futures are leveraged products and may result in rapid losses or liquidation. They do not give ownership of physical gold. Always conduct independent research and assess your financial situation and risk tolerance before investing or trading.
FAQs
Q1: Will gold prices rise in 2026?
Gold could recover during the remainder of 2026, but the latest technical structure remains under pressure, with the decline since the September Fed and BOJ rate hikes still unresolved. Published institutional gold price forecasts range from approximately $4,500 to $6,000. In the near term, gold must reclaim $4,194–$4,289 before the higher $4,500, $4,769 and $4,900 levels become technically relevant.
Q2: Is now a good time to buy gold?
Suitability depends on investment horizon and allocation strategies. With price trading below its four-hour EMAs and testing support in the $4,050–$4,125 zone, staggered purchases help mitigate short-term volatility compared to lump-sum entries.
Q3: Where will gold prices be in 2030?
Gold's 2030 scenarios run from $5,200 in the conservative case to $6,500 in the base case and $8,600 in the bullish case. At the present rupee rate and duty structure, those translate to roughly ₹1,83,500, ₹2,29,300 and ₹3,03,300 per 10 grams. Projections at this horizon depend on central bank accumulation, real interest rates, and global debt levels, so they describe trajectories rather than targets.
Q4: Where will gold prices go in the next 5 years in India?
Indian gold prices track the international price adjusted for the rupee, the 15% import duty and GST, so the local figure can move even when the dollar price does not. Applying the base-case path to today's rupee and duty structure gives roughly ₹1,69,300 per 10 grams in 2027, rising toward ₹2,29,300 by 2030. Festive and wedding demand adds seasonal support, while a stronger rupee would mute gains that look larger in dollar terms.
Q5: Should I invest in physical gold or digital gold?
Physical gold gives tangible ownership but carries storage, purity and making-charge costs that reduce the effective return. Digital and tokenised products offer transparent pricing, fractional purchases and no custody burden, though they introduce issuer or counterparty considerations of their own. The choice depends on whether the priority is holding the metal itself or tracking its price efficiently.
Q6. Why is gold falling?
Gold prices are falling primarily because rising crude oil prices have fueled fresh inflation worries, boosting expectations that the U.S. Federal Reserve will keep or raise interest rates. Higher bond yields and a strong U.S. dollar make interest-bearing assets more attractive than gold, which pays no interest.
Q7. Will gold crash in 2026?
A gold-price crash is not the central scenario in the published forecasts, but further corrections remain possible. The immediate downside levels are $4,100, $4,050 and $3,950, with gold already having broken through the $4,230 support that capped the prior decline. A sustained break below these supports would weaken the outlook further, while a recovery above $4,330 would reduce the near-term downside risk.
8. Will gold reach ₹2 lakh per 10 grams?
Gold reaching ₹2 lakh per 10 grams would require the international price to reach roughly $5,670 on an MCX basis, or about $5,505 once GST is included, at the current ₹95.4 rupee rate and 15% duty. Both figures sit close to the all-time high of $5,597, which itself converts to about ₹1,97,400 per 10 grams today. J.P. Morgan's $6,000 target would clear the mark, so ₹2 lakh is best understood as a record-high-equivalent level rather than a near-term expectation.
Q9. Will the gold rate decrease in the coming days in 2026?
Gold prices could decrease further if the price fails to recover above $4,157 and subsequently breaks below $4,100. That could bring $4,050 and $3,950 into focus. Conversely, a recovery above the $4,194–$4,289 EMA cluster would improve the short-term gold price forecast.
Q10. Will gold cross ₹2 lakh in 2026?
Gold crossing ₹2 lakh per 10 grams in 2026 would require an increase of approximately 33%–37% from current indicative Indian and MCX levels. This would likely require international gold to move towards the upper end of the most bullish institutional forecasts alongside a supportive USD/INR movement.
Q11. Is XAU-USDT tokenized gold?
XAU-USDT is a gold-linked perpetual futures contract rather than a tokenised holding of gold. It provides derivative exposure to the gold price with leverage available and does not represent ownership of physical metal or of any gold-backed token.
Q12. What is the difference between PAXG spot and PAXG-USDT futures?
PAXG spot means holding the gold-backed token itself, subject to the issuer's terms and redemption conditions. PAXG-USDT futures are derivatives linked to that token's price and convey no ownership of PAXG or of the gold underlying it. The distinction matters for how each product behaves in a stressed market and for what happens to a leveraged position.
Q13. Is gold forecast to rise or fall next week?
Gold is forecasted to trade mostly range-bound with a slight downward or sideways bias ahead of next week's Federal Reserve policy meeting, hovering near $4,100–$4,200 per troy ounce as high Treasury yields and inflation concerns offset safe-haven demand
Q14. Will the gold rate decrease in the coming days in 2027?
Gold's 2027 outlook points higher rather than lower in most published research, though short-term corrections will still occur. J.P. Morgan forecasts an average of $6,263 across 2027, having trimmed that figure by 4.4% from its earlier estimate, while the Reuters poll puts the 2027 average nearer $4,610. The gap between those two numbers is the same Federal Reserve disagreement that drives the 2026 forecasts.
Q15. What will gold cost in 2028?
Gold in 2028 sits between $4,400 and $7,000 across the scenarios above, with a base case of $5,300 per ounce. Those figures convert to roughly ₹1,55,200 to ₹2,46,900 per 10 grams at the current rupee and duty structure. No major institution publishes a formal 2028 target, so these are extrapolations from the 2026 and 2027 institutional ranges.