
This guide provides a Stacks crypto price prediction using technical indicators such as the Relative Strength Index (RSI), exponential moving averages (EMAs), and volume profiles. Explore STX price forecasts for today, this week, and the long term through 2040, along with key support and resistance levels, momentum analysis, and market outlook.
Currently, Stacks (STX) is trading near $0.3888, up 4.54% after opening at $0.3716 and printing an intraday high of $0.3920, as per the latest daily chart. The 14-day RSI has climbed to 71.43, moving above the 70 overbought line and sitting 4.71 points above its 14-day signal moving average at 66.72. Concurrently, the 20-day, 50-day, 100-day, and 200-day EMAs are positioned at $0.3157, $0.2688, $0.2376, and $0.2456, respectively. The 50-day EMA now sits $0.0232 above the 200-day EMA after crossing it in the second half of September, while the 100-day EMA is still $0.0080 below the 200-day line, so the averages are not yet in full bullish order. With spot price trading 23.2% above its rising 20-day EMA, STX is positioned to test $0.40 while treating the $0.36 breakout zone as the first support to defend.
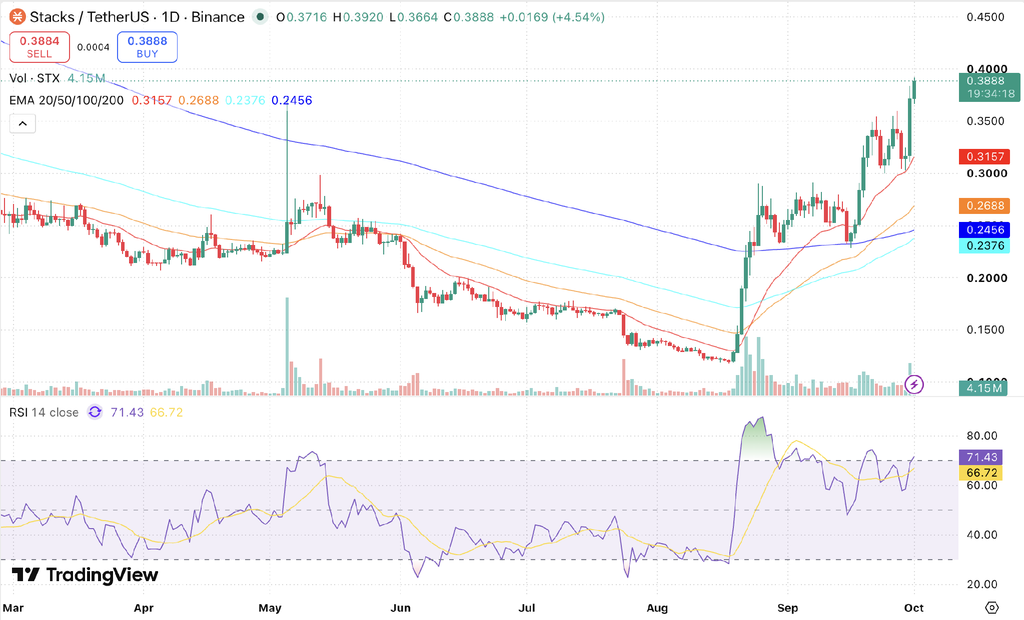
STX/USDT daily chart data sourced from TradingView
Key Insights
- Short-term outlook: STX opened at $0.3716, set a high of $0.3920, and trades near $0.3888 in the top eighth of a $0.0256 daily range. Immediate support rests at the session low of $0.3664, followed by the $0.36 breakout zone, with $0.3920 and the $0.40 round number serving as the immediate overhead barriers.
- Medium to long-term outlook: The 50-day EMA at $0.2688 sits $0.0232 above the 200-day EMA at $0.2456 following its September golden cross. The 100-day EMA at $0.2376 is still $0.0080 under the 200-day but rising faster, which sets up a second golden cross if the advance holds.
- Technical analysis: RSI has pushed to 71.4, above the 70 overbought mark and 4.7 points over its moving average at 66.7. Volume is 4.15M STX with the candle only about 18% done, already ahead of most full sessions in September.
New to STX? Read our guide on what is Stacks to understand the project before exploring its price outlook.
Trade STX in INR on 
Deposit and withdraw in INR (₹).
No Conversion to Crypto Required.

Stacks Short-Term Price Prediction: Today, This Week, October 2026
Here is the STX price prediction 2026 for today, this week, and October 2026.
| Timeframe | Price Target | Support | Resistance | ROI |
|---|---|---|---|---|
| Next 24 Hrs | $0.3950 | $0.3664 | $0.4000 | +1.59% |
| This Week | $0.4100 | $0.3600 | $0.4300 | +5.45% |
| October 2026 | $0.4400 | $0.3157 | $0.4800 | +13.17% |
Stacks Price Prediction Today
Stacks’ 24-hour price prediction is $0.3950, about 1.6% above the current level. The STX price is at $0.3888, and this target relies on the session low of $0.3664 holding as first support after the breakout. A close above $0.3920 is required before $0.40 comes into range, whereas a break below $0.3664 opens an immediate retest of the $0.36 zone.
Stacks Coin Price Prediction for This Week
The weekly forecast for STX is $0.4100, inside an expected channel of $0.3600 to $0.4300. Today’s move cleared the $0.36 ceiling that capped rallies in late September and also sits above the early May spike high in the same area, so that zone now flips to support. A daily close above $0.40 is needed to confirm follow-through. With RSI above 70, a pullback toward $0.36 would be a normal retest, but a close beneath it would put the 20-day EMA at $0.3157 back in play.
Stacks Price Prediction for October 2026
Stacks’ October 2026 price prediction is $0.4400, within a monthly corridor of $0.3157 to $0.4800. Reaching this milestone requires a confirmed daily close above $0.40, which would extend a rally that has already more than tripled STX from its August low near $0.12. A 100-day and 200-day EMA cross, now just $0.0080 away, would give October a firmer structural base. If $0.40 caps further rallies, October is projected to consolidate between $0.3157 and $0.40.
Stacks Coin Price Prediction for November 2026
November 2026 carries a $0.4800 target, with a range of $0.4000 to $0.5200. That path assumes October clears $0.44 first, because the two months stack rather than run in parallel. The 20-day EMA at $0.3157 must keep rising beneath price to hold the short-term trend together. A November close below $0.40 would delay the sequence and push the $0.52 year-end target into 2027.
Stacks Price Prediction 2026 (Medium Term)
| Month | Price Target | Support | Resistance | ROI |
|---|---|---|---|---|
| Oct 2026 | $0.4400 | $0.3157 | $0.4800 | +13.17% |
| Nov 2026 | $0.4800 | $0.4000 | $0.5200 | +23.46% |
| Dec 2026 | $0.5200 | $0.4300 | $0.5800 | +33.74% |
Stacks’ 2026 price range is projected at $0.3157 to $0.5200. The moving average structure is improving but not yet complete: the 20-day EMA at $0.3157 leads the 50-day at $0.2688 by $0.0469, and the 50-day sits $0.0232 above the 200-day at $0.2456. The 100-day EMA at $0.2376 is the one line still out of order. Spot price holds a 58.3% cushion above the 200-day line, which protects the macro trend but also shows how stretched this leg has become.
| Want to diversify beyond Stacks? Check out the Top 10 Cryptos To Invest In 2026 |
Stacks Price Prediction in INR (2026-2030)
For Indian traders, here is what the STX price targets translate to in rupees.
| Period | STX Target USD | STX Price INR est. |
|---|---|---|
| October 2026 | $0.44 | ₹42.28 |
| December 2026 | $0.52 | ₹49.97 |
| 2027 | $0.60 | ₹57.66 |
| 2030 | $1.20 | ₹115.32 |
INR estimates based on a USD/INR rate of ~₹96.1. Rate fluctuations will affect actual INR values.
Stacks Long-Term Price Outlook (2027-2040)
The long-term outlook for STX rests on three structural drivers: adoption of self-custodial Bitcoin staking through Bitcoin Bonds following the PoX-5 upgrade, growth of sBTC as the main route for BTC into Stacks DeFi, and the 2028 Bitcoin halving, which also cuts new STX issuance and has historically shaped the wider digital asset cycle.
The following forecasts are derived from Bitcoin halving-cycle analysis, Bitcoin staking and sBTC adoption scenarios, and historical STX volatility patterns. They represent scenario ranges, not price targets.
| Year | Price Target | Support | Resistance | ROI |
|---|---|---|---|---|
| 2027 | $0.60 | $0.45 | $0.78 | +54.32% |
| 2028 | $0.80 | $0.58 | $1.05 | +105.76% |
| 2029 | $1.00 | $0.75 | $1.30 | +157.20% |
| 2030 | $1.20 | $0.90 | $1.60 | +208.64% |
| 2031 | $1.35 | $1.00 | $1.80 | +247.22% |
| 2035 | $2.00 | $1.50 | $2.80 | +414.40% |
| 2040 | $3.20 | $2.40 | $4.50 | +723.05% |
Where Will Stacks Price Go in 2030?
Stacks’ 2030 price prediction targets $1.20, within a range of $0.90 to $1.60, supported by post-2028 halving liquidity and wider use of Bitcoin staking. STX has no hard supply cap, but new issuance is cut at each Bitcoin halving, so supply growth slows over time. Demand, on the other hand, depends on how much BTC is staked through Stacks, since stakers must post STX alongside their Bitcoin.
Where Will Stacks Price Go in 2031?
The Stacks price prediction for 2031 targets $1.35, with a range of $1.00 to $1.80, as the market enters the post-2028 cycle digestion phase. Cycle models treat 2031 as a consolidation year following cycle expansion. The amount of BTC locked in Bitcoin Bonds, sBTC supply on Stacks, and stacking yields will serve as the primary metrics to track.
Where Will Stacks Price Go in 2040?
By 2040, the STX price is projected at $3.20, ranging from $2.40 to $4.50, as Bitcoin’s role as a programmable base layer matures. The top of this range would take STX back above its all-time high of about $3.86 from April 2024, which shows how much ground the token still has to recover. These forecasts carry high uncertainty and should be read as scenario ranges, not fixed targets.
Stacks Technical Analysis
The following technical indicators were used to derive the Stacks price prediction above.
| Indicator | Value | Signal |
|---|---|---|
| Relative Strength Index (14-Day RSI) | 71.43 | Rising, above the 70 overbought line |
| RSI Moving Average | 66.72 | RSI now 4.7 points above it |
| 20-Day EMA | $0.3157 | Support, price 23.2% above |
| 50-Day EMA | $0.2688 | Now $0.0232 above the 200-day EMA |
| 100-Day EMA | $0.2376 | Still $0.0080 below the 200-day EMA |
| 200-Day EMA | $0.2456 | Macro floor, price 58.3% above |
| Trading Volume, session to date | 4.15M STX | Candle roughly 18% complete |
Relative Strength Index (RSI)
The 14-day RSI has climbed to 71.43, crossing above the 70 overbought threshold and sitting 4.71 points over its 14-day signal moving average at 66.72. The positive spread confirms that buyers are in control after the break above $0.36. The reading is stretched, though. The last time RSI ran this hot, in late August, it peaked near 87 and price then spent close to four weeks ranging between roughly $0.23 and $0.29. Holding above 66.72 while price defends $0.36 keeps momentum intact, whereas a drop back under 60 would expose the 20-day EMA at $0.3157.
Exponential Moving Averages: 20-Day, 50-Day, 100-Day and 200-Day EMA
STX trades above all four EMAs, sitting 23.2% above the 20-day EMA at $0.3157, 44.6% above the 50-day EMA at $0.2688, 63.6% above the 100-day EMA at $0.2376, and 58.3% above the 200-day EMA at $0.2456. The 50-day crossed above the 200-day in the second half of September and now leads it by $0.0232. The 100-day is the laggard. It is still $0.0080 under the 200-day, but it is rising faster and the gap is closing, so a second golden cross is within reach if price holds above $0.30. The cushion over the 20-day EMA is the part to watch. At 23.2%, it is wide for a token that has already more than tripled since August, and moves this stretch usually cool off through either a pullback or a sideways phase while the averages catch up.
Volume Analysis
Session volume reflects 4.15M STX with roughly 18% of the daily candle complete, already ahead of most full sessions in September. Because this volume arrived on a push to $0.3920 rather than on a rejection, it points to buyers chasing the breakout instead of sellers distributing into it. The test comes at the close. A daily close above $0.38 would confirm acceptance above the breakout zone, while a close back below $0.3664 would flag a failed breakout and direct price toward $0.36.
What Is the Stacks Price Prediction for Indian Traders?
STX works out to roughly ₹37.4 at current rates and can be traded directly in INR on CoinDCX, with no USD conversion or international transfer required. Against the 2030 base case of ₹115.32, that is a potential 3.1x over four years. The near-term catalyst is Bitcoin staking. The PoX-5 upgrade went live on 30 July, the first Genesis Bond opened on 10 September with institutions committing about 250 BTC, and the second bonding period begins in early October. With RSI above 70 and price 23% over its 20-day EMA, staged entries through CoinDCX’s Crypto Investment Plan (CIP) carry less timing risk than a single purchase at these levels.
Disclaimer
This article is for informational purposes only and does not constitute financial or investment advice. Digital asset markets are highly volatile and prices can change rapidly. Past performance is not indicative of future results. The price predictions above are based on technical and on-chain analysis and should not be construed as investment recommendations. Always conduct your own research before making any trading or investment decisions.
FAQs
Q1. Will Stacks go up?
Stacks can go higher from here if it closes above $0.40 and holds the $0.36 breakout zone. The trend supports it, with price above all four EMAs and the 50-day already over the 200-day. The risk is short term. RSI is at 71.4, in overbought territory, so a pullback toward $0.36 before the next leg would not be unusual.
Q2. Can STX reach $1?
STX can reach $1, but not in 2026 on its current structure. The base case puts STX at $1.00 in 2029 and $1.20 by 2030, which needs roughly a 2.6x move from $0.3888. Getting there depends on how much BTC flows into Stacks staking and whether sBTC usage keeps growing through the 2028 halving cycle.
Q3. What will 1 STX be worth in 2030?
1 STX is projected to be worth around $1.20 in 2030, within a range of $0.90 to $1.60. The same models point to $2.00 by 2035 and $3.20 by 2040. These are scenario ranges tied to Bitcoin staking adoption, not fixed targets.
Q4. What is Stacks used for?
Stacks is a Bitcoin layer that adds smart contracts and DeFi to Bitcoin without changing Bitcoin itself. Its transactions settle on Bitcoin, and sBTC lets BTC holders use their coins inside Stacks apps. The STX token pays network fees, secures the chain through Proof of Transfer, and earns BTC rewards when stacked.
Q5. What is Bitcoin staking on Stacks?
Bitcoin staking on Stacks lets BTC holders lock their coins in self-custodial Bitcoin Bonds and earn BTC rewards. The PoX-5 upgrade that enabled it went live on 30 July 2026, and the first Genesis Bond opened on 10 September. Stakers post STX alongside their BTC, which ties STX demand directly to how much Bitcoin is staked.
Q6. What is the all-time high (ATH) of STX?
The all-time high of STX is about $3.86, set in April 2024. At $0.3888, the token trades roughly 90% below that peak, so even the 2035 base case of $2.00 sits well under the record.
Q7. Is Stacks a good investment in 2026?
Whether Stacks is a good investment in 2026 depends on entry timing more than trend direction. The base case puts STX between $0.3157 and $0.52 through year-end, and the trend has turned clearly bullish since August. With RSI above 70 and price 23% over its 20-day EMA, staged entries reduce the risk of buying the top of this leg.
Q8. How is STX taxed in India?
Profits from selling STX are taxed at a flat 30% plus 4% cess, whatever your slab or holding period. A 1% TDS applies on transfers, and losses cannot be set off against other income or carried forward. Each transaction must be reported in the VDA schedule of your income tax return. See our guide to crypto taxes in India for the full rules.
Q9. Where can I buy STX in India?
You can buy STX in India on CoinDCX, directly INR. Download the CoinDCX App, complete verification, fund your wallet, and buy STX. There is no USD conversion or international transfer involved, and CoinDCX is registered with FIU-IND.