coindcx-blog-logo-2026coindcx-blog-logo-2026coindcx-blog-logo-2026coindcx-blog-logo-2026
  • CRYPTO NEWS
  • TOPICS
    • Futures Trading
    • Crypto Basics
    • DeFi
    • Metaverse
    • NFT
    • Blockchain
  • CRYPTO VERSE
    • Personal Finance
    • Cryptocurrency
    • Price Predictions
    • Crypto Deep Dives
  • PRODUCT
    • Tutorials
    • Product Features
    • Security
  • COINDCX
    • Announcements
    • Community
    • Crypto Competition
    • Listings
    • Opinion
    • Stories
Visit CoinDCX
✕
            No results See all results

            Blog / Crypto News Global / DOT Reclaims $1 but Stalls at Its 200-Day EMA

            DOT Reclaims $1 but Stalls at Its 200-Day EMA

            Polkadot gained 19% on 7 September 2026 as daily transaction…

            9 Sep 2026 | 3 min read

            Table of Contents

            Toggle
            • What Drove the 19% DOT Rally
            • The Short Squeeze Behind the Move
            • Derivatives and Institutional Flow Indicators
            • Technical Resistance at the 200-Day EMA
            • On-Chain Usage Is Rising From a Low Base
            • What DOT Traders Should Watch
            • FAQs
            • 1. Why did the Polkadot price rise?
            • 2. Has DOT broken its downtrend?
            • 3. What DOT price levels matter now?
            • 4. Is institutional money behind the DOT rally?

            Polkadot gained 19% on 7 September 2026 as daily transaction activity expanded by 150% and a short squeeze cleared leveraged sell positions. The rally pushed DOT to an intraday high of $1.259 before settling near $1.202, meeting resistance right around its 200-day exponential moving average (EMA). This technical hurdle remains the primary dividing line between a short-term relief bounce and a broader structural trend reversal. 

            What Drove the 19% DOT Rally

            The recent 24-hour surge in DOT price coincided with a 150% rise in daily network transactions. Cross-Consensus Messaging (XCM) throughput, the protocol framework responsible for transferring data and assets across Polkadot parachains, also reached fresh quarterly highs during the same window.

            From a development perspective, Polkadot introduced native smart contracts supporting both Polkadot Virtual Machine (PVM) and Ethereum Virtual Machine (EVM) environments in December 2025. This was followed by a July 2026 staking architecture upgrade that shortened the unbonding period from 28 days to roughly 48 hours while eliminating nominator slashing risks.

            The Short Squeeze Behind the Move

            A sharp reversal on 5 September triggered the initial squeeze, liquidating around $610,000 in market positions, mostly shorts, and pushing DOT above $1.03 for the first time in several months. Forced buying from those closures amplified a move that spot demand alone would not have produced.

            AMBCrypto recorded $575,190 of short liquidations compared to $454,490 in long liquidations across a 24-hour period, a gap of about $121,000. Sustained market reversals generally feature wider liquidation imbalances, suggesting this initial breakout requires further follow-through volume to confirm stability.

            Derivatives and Institutional Flow Indicators

            Derivatives metrics showed open interest rising 13% to approximately $203 million, while the open-interest-weighted funding rate hovered near 0.0095%. Positive funding rates alongside expanding open interest point to new leveraged long positions rather than passive short covering.

            CoinGabbar noted that the spot DOT ETF has recorded neither net inflows nor outflows since 8 June, so no institutional flow supports the move. It rests on retail buying and derivatives positioning.

            Technical Resistance at the 200-Day EMA
            DOT Reclaims $1 but Stalls at Its 200-Day EMA

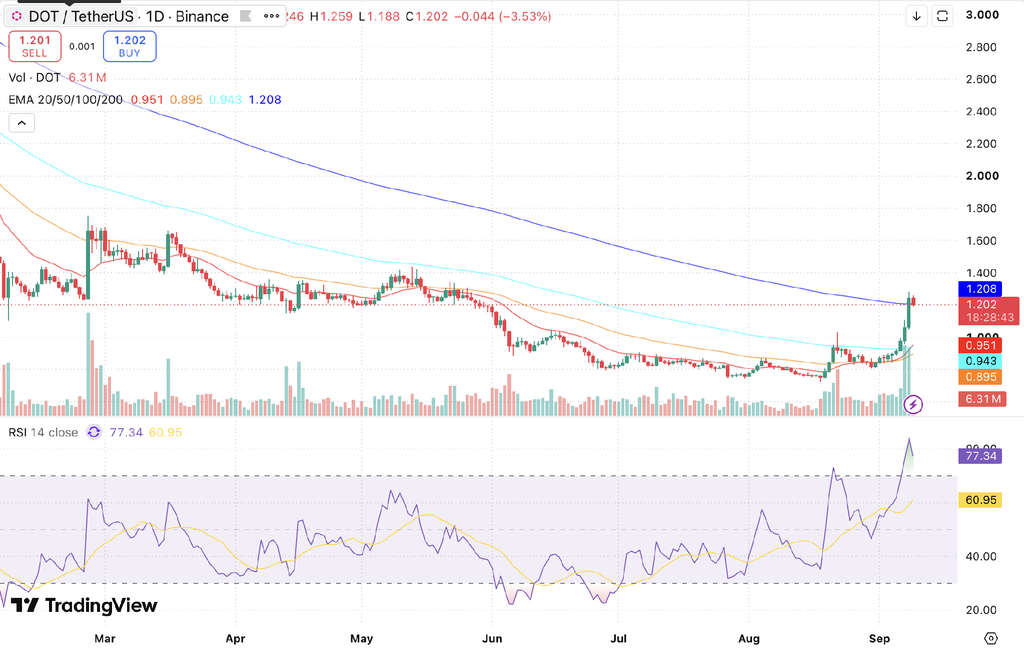
            DOT/USDT daily chart with EMA 20/50/100/200 and RSI 14. Source: TradingView

            DOT touched $1.259 and closed at $1.202. Its 200-day exponential moving average sits at $1.208, so the rally stopped half a percent short of that line and reversed. CoinMarketCap separately named $1.21 as the next resistance, arriving at the same level by a different route.

            The 200-day at $1.208 sits above the 20-day at $0.951, the 100-day at $0.943, and the 50-day at $0.895, The technical structure shows the 200-day EMA ($1.208) sitting above the 20-day EMA ($0.951), 100-day EMA ($0.943), and 50-day EMA ($0.895). This descending arrangement reflects a macro downtrend until shorter-term moving averages cross above long-term resistance. Meanwhile, the 14-day Relative Strength Index (RSI) reached 77.34 against its signal line of 60.95, signaling short-term overbought conditions.

            On-Chain Usage Is Rising From a Low Base

            Artemis data puts Polkadot transactions above 13,800 over the past month and daily active users near 2,700. Those figures are growing but small for a network of Polkadot’s size, so the 150% jump reflects a low starting point as much as new demand.

            To get a longer-term view, read our Polkadot (DOT) Price Prediction

            What DOT Traders Should Watch

            A daily close above $1.208 would put the shorter moving averages on a path to cross the 200-day, which is what a broken downtrend looks like. Failure there leaves $0.83 to $0.84 as the support that held through July and August.

            Watch whether transaction counts hold near current levels once the squeeze fades, and whether the DOT ETF records any flow after three months of nothing.

            FAQs

            1. Why did the Polkadot price rise?

            Polkadot rose 19% on 7 September 2026 driven by a 150% increase in daily transaction volume, record quarterly XCM messaging throughput, and a short squeeze that liquidated over $610,000 in derivatives positions.

            2. Has DOT broken its downtrend?

            DOT has not broken its downtrend yet. It closed at $1.202, just below its 200-day exponential moving average at $1.208, and the shorter moving averages still sit beneath the long one. A daily close above $1.208 would be the first technical evidence that the downtrend has ended.

            3. What DOT price levels matter now?

            The 200-day exponential moving average at $1.208 is the level DOT stalled at, and CoinMarketCap names $1.21 as resistance. Below the current price, the $0.83 to $0.84 zone is the support that held through July and August.

            4. Is institutional money behind the DOT rally?

            No institutional money is behind the DOT rally. The spot DOT ETF has recorded neither net inflows nor outflows since 8 June, so the move comes from retail buying and derivatives positioning. Open interest rose 13% to about $203 million, with funding near 0.0095%, meaning longs were paying shorts.
            Trade Crypto in INR

            India’s Most Trusted Crypto Exchange

            Install Now!

            Share:
            All Blogs
            Trade Crypto in INR

            India’s Most Trusted Crypto Exchange

            Install Now!

            Recent Articles

            Zcash ETF Crosses $500M AUM as ZCSH Options Begin Trading

            Venice Token Jumps 38% as Kalshi Lists VVV Perpetuals

            Related posts

            Venice Token Jumps 38% as Kalshi Lists VVV Perpetuals

            Venice Token (VVV) surged 38.03% to trade near $25.36 on…


            Read more
            9 Sep 2026
              | 4 min read

            Hunter Biden’s LAPTOP Memecoin Launches 9 September on Base

            LAPTOP debuts on Wednesday with a fixed one billion token…


            Read more
            8 Sep 2026
              | 3 min read
            coindcx-logo-india-ka-crypto-coach
            Company
            • About Us
            • Blog
            • Careers
            • Fees
            • Proof of Reserves
            • Partners
            • Bug Bounty
            • Community
            • Policy
            • C.I.P. Fund
            Product
            • Spot Trading
            • Margin Trading
            • Convert
            • Futures Trading
            • Earn
            • VIP
            Support
            • 24/7 Chat Support
            • Support Center
            • Terms of Use
            • Privacy Policy
            • Risk Disclosures
            • Security
            • Terms of Use: Web3 Wallet
            • Media Kit
            Business
            • OTC
            • API Broker
            • Enterprise
            • New Coin Listing
            • Ventures
            • Affiliate
            Buy Cryptos
            • Buy Bitcoin
            • Buy Ethereum
            • Buy Solana
            • Buy Ripple
            • Buy Dogecoin
            • Buy Shiba Inu
            • Buy Pepecoin
            Price Prediction
            • Bitcoin Price Prediction
            • Ethereum Price Prediction
            • Ripple Price Prediction
            • Dogecoin Price Prediction
            • Solana Price Prediction
            • Litecoin Price Prediction
            • All Price Predictions
            Contact Us

            Press Enquiries write to [email protected]
            Regulatory Issues/Enforcement Authorities: [email protected]
            For Grievance Redressal, Click here to know more.

            Disclaimer

            Crypto products & NFTs are unregulated and can be highly risky. There may be no regulatory recourse for any loss from such transactions. The information and material contained herein are subject to change without prior notice including prices which may fluctuate based on market demand and supply. The material available on the site is proprietary to CoinDCX, its parent, Licensor and/or its affiliates and is for informational purposes and informed investors only. This material is not: (i) an offer, or solicitation of an offer, to invest in, or to buy or sell, any interests or shares, or to participate in any investment or trading strategy, or (ii) intended to provide accounting, legal, or tax advice, or investment recommendations.

            *Internal CoinDCX Data as on 6th May 2025
            *Quarterly trading volume for Q4 FY’24-25. Currency conversion rate applied as in data capturing period
            *FIU Registered entity, NEBLIO TECHNOLOGIES PVT LTD
            *Certified in India for May 2023-24

            © 2024 All rights reserved

            Visit CoinDCX
                      No results See all results
                        Download App