
Key Takeaways
- Current Status: Polkadot (DOT) is trading at around $1.59, a 3.25% increase over the last 24 hours. This uptick appears to have been driven by renewed short-term buying interest and slightly better overall sentiment towards altcoins. Additionally, rising trading volume and positive community sentiment, with more than 80% in favor, have helped maintain price stability even during periods when the market was mainly consolidating.
- Market Performance: Polkadot’s price fluctuated within a relatively narrow band between $1.53 and $1.65 over the last 24 hours, reflecting its stable performance. DOT is getting new attention with its $2.66 billion market cap and the uptick in trading volume. A high volume-to-market cap ratio indicates DOT is very liquid, while the slow price rise suggests investors are buying the dip that occurred during the altcoin market cycle.
- Technical Analysis: The current market analysis shows that DOT price has created a minor bearish trend, which is affecting lower time frames because DOT price currently remains below its primary short-term moving averages. The 50 EMA serves as the closest obstacle for bulls operating between $1.60 and $1.61, while the market maintains its $1.58 support level. The MACD indicator currently shows negative values, though its movement toward the horizontal line suggests traders are starting to sell less.
- Polkadot Price Prediction March 2026: Supported by stabilizing levels and increasing sentiment, Polkadot price prediction models predict an increase between 6%-8% until the price reaches $1.70 by March 2026. Increased buying activity above the $1.62 resistance level will strengthen this view, while any failure to maintain the $1.58 support level will create obstacles to short-term bullish movement.
- Future Outlook: Polkadot’s outlook has become more positive because its new tokenomics model establishes a supply cap and reduces inflation, while major system upgrades will introduce smart contracts and the JAM architecture. These developments will create a fast path to greater adoption needs. If ecosystem growth accelerates and technical momentum sustains, DOT may transition into a stronger long-term asset. The analysis indicates that Polkadot will achieve a long-term price range between $5 and $6 during market conditions that favor its performance.
India’s Most Trusted Crypto Exchange
Install Now!

Where will Polkadot Price Head Next?
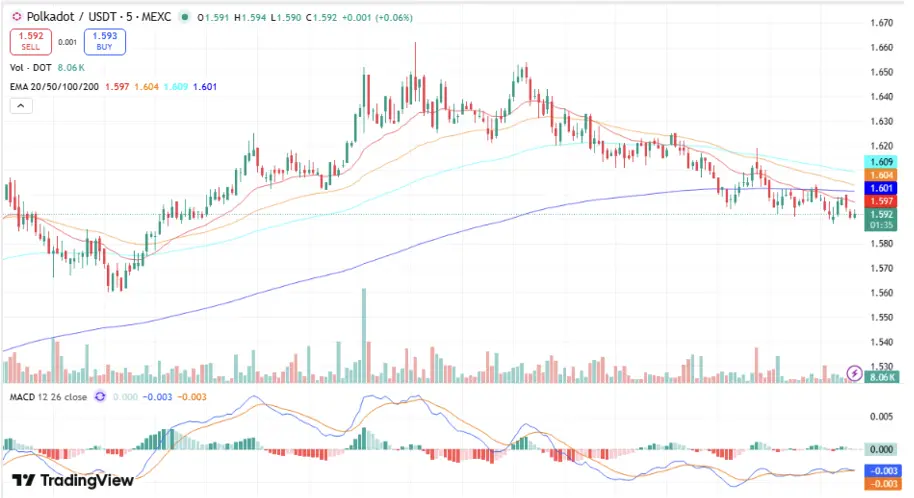
- Polkadot is currently in a tight consolidation pattern, trading near the short-term important EMAs but slightly below them. Price levels remain below the 50 and 100 EMA, indicating some bearish pressure. On the other hand, around $1.58, there is strong support holding, with no price fall at this point. This also shows that buyers are consistently coming in at these lower levels.
- Between $1.59 and $1.61, the EMAs are converging, forming a strong resistance zone. Selling pressure is evident from the price dropping at this level, which means that sellers are continuing their efforts during the small rallies. A decisive breakout above $1.61 would shift short-term momentum to the bulls’ side, whereas a rejection at this level would send DOT back to the lower support zones.
- The MACD indicator shows a flat and slightly negative trend, signaling weak momentum in either direction. Also, the MACD and signal lines, which are coming closer, support the view that the market is in a period of low volatility. Usually, this situation precedes a breakout, and therefore, the next directional move will be very important for confirming the trend.
- Overall, DOT is showing signs of accumulation within a narrow range. If the bulls hold the $1.58 support and volume goes up, a breakout towards $1.63-$1.65 is the most likely scenario. On the other hand, if support breaks, there will be substantial selling pressure, and the price may quickly drop to the $1.54 level in the near term.
| Indicator | Value |
|---|---|
|
Support levels (Fibonacci, S1/S2/S3)
|
$1.58 / $1.56 / $1.54 |
|
Resistance levels (Fibonacci, R1/R2/R3) |
$1.61 / $1.63 / $1.65 |
|
20-day EMA |
$1.597
|
|
50-day EMA |
$1.604 |
|
100-day EMA |
$1.609
|
|
200-day EMA |
$1.601 |
|
MACD |
-0.003
|
Polkadot Price Prediction Daily
Currently, Polkadot is moving sideways around $1.59 with very little price fluctuations in the near future. Given the current trend and resistance around $1.61, Polkadot is set to rise by 2%-3% and possibly hit $1.63 within the next 24 hours. On the other hand, not surpassing the immediate resistance level might keep the price within the $1.58 to $1.61 range, as traders await volume surges to confirm the next move.
Also read: Top Polkadot Ecosystem Tokens by Market Cap
Polkadot Price Prediction Weekly
In the upcoming week, Polkadot is likely to trade within a narrow range as market sentiment is expected to be cautiously optimistic. Given the firm support at $1.56 and resistance at $1.65, Polkadot’s price is expected to increase by 4%-6% and possibly reach $1.68 by week’s end. Consistent buying pressure and a breakout above the EMA cluster could act as a green light for the bulls, whereas weak volume might limit price gains in the short term.
Disclaimer: Polkadot coin price predictions are speculative. Markets are volatile, do your own research before investing.
Polkadot Price Prediction (March 2026)
Polkadot may maintain its steady recovery trend, in line with the improving sentiment in the altcoin space. The accumulation near the current price level indicates Polkadot is expected to rise about 6%-10% and potentially hit $1.72 by the end of March 2026. A breakout that is well sustained above $1.65 may lead to an acceleration of gains; however, if the overall market moves lower, DOT might just be stuck in a consolidation range with fluctuations until a new trend is established.
Polkadot Price Prediction (April 2026)
Polkadot is likely to be the major beneficiary of the market’s upward momentum if bullish sentiment spreads throughout the crypto sector and is maintained. It is forecast that the price of Polkadot could increase by 20%–25%, and potentially reach around $2.01 by the end of April 2026. The support for this move could come from the higher lows and growing volumes, while a slight stall in the price rally due to the resistance at the psychological levels might be ahead before medium-term further upside appears
Polkadot Price Prediction in INR:
At a USD/INR rate of about ₹83.50, DOT’s price currently sits near ₹333. If the bounce holds, the Polkadot price prediction in INR for September 2025 could target ₹375–₹500, depending on global crypto flows and the strength of fresh capital rotation back into altcoins
By 2026, Polkadot price is predicted to trade within the range of $45 to $50, signaling a substantial uptrend fueled by robust market fundamentals. Technical analysis suggests strong bullish momentum, with potential breakout scenarios above key resistance levels. Traders may strategically enter the market to capitalize on upward price movements, optimizing their trading strategies for maximum profitability. External factors, such as market sentiment and adoption trends, could significantly influence Polkadot price trajectory during this period. Traders should remain adaptable and responsive to evolving market conditions, ensuring they align their positions with emerging trends for optimal performance.
In 2027, Polkadot price is anticipated to trade within the range of $30 to $35, indicating continued bullish momentum. Technical analysis suggests a sustained uptrend supported by robust market fundamentals and increasing investor interest. Traders may explore strategic entry points above key resistance levels, aiming to capitalize on upward price movements. External factors, such as market developments and regulatory trends, could significantly influence Polkadot price trajectory during this period. Traders should remain vigilant and adaptable to evolving market conditions, adjusting their strategies accordingly to optimize returns amidst the bullish market sentiment.
By 2028, Polkadot price is poised to move within the range of $52 to $61, marking a significant uptrend driven by strong market fundamentals. Technical indicators suggest bullish momentum, with potential breakout scenarios above critical resistance levels. Traders may strategically position themselves to capitalize on upward price movements, optimizing their trading strategies for maximum profitability. External factors, such as market sentiment and adoption trends, may further fuel Polkadot price trajectory, driving it towards higher levels. Traders should remain adaptive and responsive to changing market dynamics, ensuring they align their positions with emerging trends for optimal performance.
In 2029, Polkadot price is predicted to trade within the range of $100 to $110, signaling a monumental milestone in its price trajectory. Technical indicators suggest a strong bullish trend supported by robust market fundamentals and increasing adoption. Traders may strategically position themselves to capitalize on upward price movements, optimizing their trading strategies for maximum profitability. External factors, including macroeconomic trends and regulatory developments, may further bolster Polkadot price trajectory, driving it towards higher levels. Traders should remain adaptable and responsive to changing market dynamics, ensuring they align their positions with emerging trends for optimal performance.
In 2030, Polkadot price is anticipated to surge within the range of $80 to $100, marking a monumental milestone in its price trajectory. Technical indicators suggest a strong bullish trend supported by robust market fundamentals and increasing adoption. Traders may strategically position themselves to capitalize on upward price movements, optimizing their trading strategies for maximum profitability. External factors, including macroeconomic trends and regulatory developments, may further bolster Polkadot price trajectory, driving it towards higher levels. Traders should remain adaptable and responsive to changing market dynamics, ensuring they align their positions with emerging trends for optimal performance.
Polkadot Price Forecast (2026–2031)
Year | Min Price ($) | Min (₹) | Avg Price ($) | Avg (₹) | Max Price ($) | Max (₹) | ROI (Avg %) |
2026 | 1.40 | ₹120 | 1.75 | ₹151 | 2.20 | ₹189 | — |
2027 | 1.80 | ₹155 | 2.40 | ₹206 | 3.20 | ₹275 | +37% |
2028 | 2.50 | ₹215 | 3.40 | ₹292 | 4.50 | ₹387 | +94% |
2029 | 3.60 | ₹310 | 4.80 | ₹413 | 6.20 | ₹533 | +174% |
2030 | 5.00 | ₹430 | 6.80 | ₹585 | 9.00 | ₹774 | +288% |
2031 | 7.20 | ₹619 | 9.50 | ₹817 | 12.50 | ₹1,075 | +442% |


