


Gold is trading near $4,602 per ounce on 27 August 2026, up 0.16% on the session after opening at its low of $4,594.54 and running as high as $4,643.14 before easing back. The metal sits above all four major daily moving averages, with the 20-day EMA at $4,427.32, the 50-day at $4,326.26, the 100-day at $4,359.87 and the 200-day at $4,311.56.
Momentum has flattened, with the 14-day RSI at 66.82 sitting barely above its own average of 66.64 and just over three points below overbought. Holding above the $4,574 retracement level keeps the August advance intact, while the $4,769 to $4,774 band is the next serious test.
Gold Price Today in India and Global Markets
| Market | Latest price on 27 August 2026 |
|---|---|
| Spot gold (XAU/USD) | $4,601.87 per ounce |
| Daily open | $4,594.54 |
| Day high | $4,643.14 |
| Day low | $4,594.54 |
| Daily change | +0.16% |
| MCX gold futures | Around ₹1,62,097 per 10 grams |
| Retail 24K gold | Around ₹1,62,500 per 10 grams |
| USD/INR | Around ₹95.4 |
| Gold-to-silver ratio | About 66.9 |
Spot values read from the daily XAU/USD chart during the IST afternoon session on 27 August 2026, with the daily candle still open at the time of writing. Indian physical prices vary with GST, city, dealer margins and jewellery-making charges.
Gold Price Technical Analysis
The daily chart shows gold above every major moving average, but the arrangement of those averages is not yet a clean uptrend. The 20-day EMA sits on top and the 200-day sits at the bottom, which is the correct ordering at both extremes. The middle of the stack is still crossed: the 50-day EMA at $4,326.26 remains $33.61 below the 100-day at $4,359.87. Until the 50-day clears the 100-day, the structure reads as a recovery in progress rather than a confirmed trend.
| Indicator | Reading | Signal |
|---|---|---|
| Gold price | $4,601.87 | Above all four daily EMAs |
| 20-day EMA | $4,427.32 | First support, 3.94% below spot |
| 50-day EMA | $4,326.26 | Below the 100-day, stack not resolved |
| 100-day EMA | $4,359.87 | Level the 50-day must clear |
| 200-day EMA | $4,311.56 | Long-term trend support |
| RSI (14) | 66.82 | Bullish but flattening |
| RSI average | 66.64 | Only 0.18 below the RSI itself |
| MACD line | 124.97 | Above its signal at 102.36 |
| MACD histogram | +22.61 | Positive, momentum still with buyers |
Indicator values read from the daily XAU/USD chart on 27 August 2026. The daily candle was still open at the time of writing, and this price feed does not publish a reliable volume series, so no volume reading is quoted.
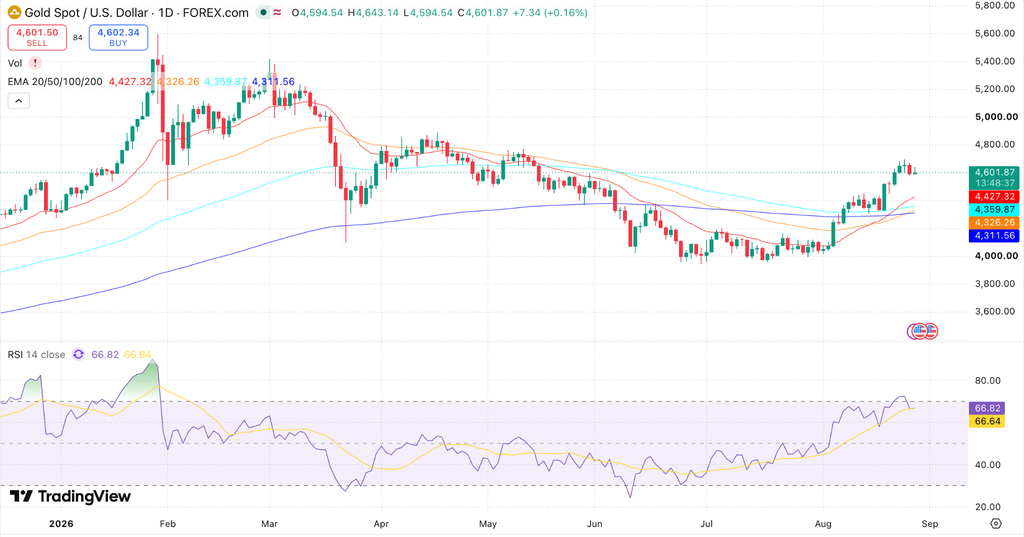
Source: TradingView.
The RSI reading is at 66.82 against an average of 66.64, narrowing the gap to 0.18 points, which means the momentum that drove the August advance has stopped accelerating. Gold also rallied 1.06% off the session open to $4,643.14 and then gave back most of it to trade 0.89% below that high. Neither observation is bearish on its own, but together they describe a market that is meeting supply rather than breaking through it.
Is Gold Bullish or Bearish?
Gold’s trend is bullish but its momentum is not. The price sits above all four major moving averages, but the 50-day EMA at $4,326.26 is still below the 100-day at $4,359.87, so they have not formed a confirmed uptrend. The 14-day RSI at 66.82 is just 0.18 points above its average of 66.64, so the rally has stopped speeding up. A close above $4,769 turns it bullish; a close under $4,574 turns it bearish.
The August rise came from a weaker dollar, not a softer Federal Reserve. The US Treasury doubled its bond buybacks, pushing the dollar to a three-month low and lifting dollar-priced metals. Cheaper oil helped, with Brent down a third day to under $86.
Inflation cuts the other way. July PCE came in at 3.7% against a 3.6% forecast, with core at 3.3%. Markets now see about a 60% chance the Fed holds rates next month, down from 64%. Fed Chair Kevin Warsh speaks at Jackson Hole on 28 August but is unlikely to signal the September decision.
Physical demand is holding firm. Chinese gold imports through Hong Kong rose about 11% in July, and central banks are still buying.
Oil and gold move off the same inflation trigger. For that side of the trade, see the Crude Oil Price Prediction.
Oil and gold are trading off the same inflation catalyst. For the energy side of that trade, see the Crude Oil Price Prediction.
Gold Price Forecast for Next Week
Gold can hold a neutral to positive bias next week while it stays above $4,574. The next directional move depends on whether buyers can clear the band that capped the May advance.
| Level | XAU/USD zone | Significance |
|---|---|---|
| Immediate resistance | $4,643 | Session high on 27 August |
| Breakout zone | $4,769 to $4,774 | 50% retracement and the May high |
| Upside target | $4,900 | Goldman Sachs year-end target |
| Immediate support | $4,574 | 38.2% retracement, now reclaimed |
| Key downside level | $4,427 | 20-day EMA |
| Major support | $4,326 to $4,360 | 50-day and 100-day EMAs |
The World Gold Council flagged two markers in its 24 August weekly note that frame the next move. Gold has cleared the 38.2% retracement of its 2026 correction at $4,574 and reclaimed its long-term moving average. The next resistance sits at the 50% retracement and the May high, a band running from $4,769 to $4,774.
| Level | XAU/USD | Significance |
|---|---|---|
| Major resistance | $4,769 to $4,774 | 50% retracement and the May high |
| Immediate resistance | $4,643 | Session high on 27 August |
| Trend pivot | $4,574 | 38.2% retracement, now reclaimed |
| First support | $4,427 | 20-day EMA |
| Cluster support | $4,326 to $4,360 | 50-day and 100-day EMAs |
| Major support | $4,312 | 200-day EMA |
Bullish scenario: A daily close above $4,643 puts the $4,769 to $4,774 band in reach. Clearing that band would be the first evidence that gold is resuming the trend rather than retracing within a correction, and it would likely coincide with the 50-day EMA crossing back above the 100-day.
Bearish scenario: A loss of $4,574 would put the August advance in question and turn attention to the 20-day EMA at $4,427. Below that, the $4,326 to $4,360 cluster where the 50-day and 100-day EMAs sit is the level that decides whether this remains a recovery or becomes another leg lower.
Will Gold Fall Today?
Gold is higher on the session rather than lower, up 0.16% after opening at its low of $4,594.54 and running to $4,643.14 before easing back. The metal gave up most of that intraday gain, which is the more useful detail: it met supply on the way up rather than breaking through it.
Whether Gold falls from here rests on two things this week.
- The first is how markets digest a July PCE print that came in hotter than forecast.
- The second is Fed Chair Kevin Warsh’s Jackson Hole remarks on 28 August, which are not expected to settle the September decision either way.
Is Now a Good Time to Buy Gold?
Long-term investors using gold for diversification often prefer staggered purchases to committing the whole amount at one price, and that logic carries extra weight here, because gold sits 17.8% below its January record with the next resistance band only about 3.6% above spot.
Short-term traders face concentrated event risk around Federal Reserve decisions, inflation data and oil, and should define risk before entering rather than after. Gold reduces portfolio concentration but generates no income and can draw down sharply, so allocation, liquidity needs and risk tolerance matter more than any single price target.
Gold Price Forecast 2026: What Analysts Expect
At one end, J.P. Morgan Global Research expects gold to average $6,000 an ounce in the fourth quarter, roughly 30% above spot. At the other, the late-July Reuters poll and the London Bullion Market Association mid-year survey both land near $4,500, which gold has already passed.
| Source | Figure | Versus spot | Type of number |
|---|---|---|---|
| Current spot | $4,601.87 | Reference | Live market |
| J.P. Morgan, Q4 2026 | $6,000 | +30.4% | Quarterly average, cut from $6,300 |
| J.P. Morgan, 2026 | $5,243 | +13.9% | Annual average, cut 8.1% in June |
| LBMA most bullish | $5,100 | +10.8% | Year-end, mid-year survey |
| Goldman Sachs | $4,900 | +6.5% | Year-end, cut from $5,400 in June |
| Reuters analyst poll | $4,509 | -2.0% | Median of 29 analysts, late July |
| LBMA mid-year survey | $4,500 | -2.2% | Year-end average of 16 analysts |
Two features of that table matter more than any single target.
- Gold now trades above the median of the most recent broad analyst poll, so the market has already overtaken the middle of the sell-side range with four months of the year still to run.
- Almost every institution has been cutting rather than raising. J.P. Morgan trimmed its 2026 average by 8.1% in June, from $5,708 to $5,243, and Goldman Sachs cut its year-end target from $5,400 to $4,900, noting that a Fed that actually delivers a hike could send gold to $4,400.
The disagreement traces back to a single question: whether the Federal Reserve hikes. J.P. Morgan names that scenario as the main risk to its own bullish view, describing a world where US growth holds up while inflation keeps accelerating, which would force the Fed to tighten and crack investor demand for a metal that yields nothing. Ten of the 16 analysts in the LBMA survey cited the Fed response to inflation as their primary concern, ahead of geopolitics and central bank buying.
CoinDCX view: The gap between $4,500 and $6,000 is not a rounding difference, it is two incompatible views of Fed policy, and readers should treat any single target with that in mind. The near-term chart is the more reliable guide. Gold needs to clear $4,769 to keep the higher targets credible, and losing $4,574 would hand the argument to the analysts who already have gold finishing the year below where it trades today.
Source: J.P. Morgan Global Research gold price forecast.
Gold Rate Forecast in India (2026)
Indian gold prices are shaped by international XAU/USD, the USD/INR rate, import duty, GST and local market conditions. The rupee is near ₹95.4 to the dollar, and India raised its gold import duty from 6% to 15% in May 2026. Domestic prices have not always reflected the full duty increase, because soft demand and ample supply have at times pushed local gold to a discount against official landed prices, according to the World Gold Council India update.
Converting the international price is straightforward: multiply the dollar price per ounce by 0.321507 to get the price per 10 grams, multiply by the USD/INR rate, then apply the customs-duty adjustment. At a spot of $4,601.87 and ₹95.4, that produces roughly ₹1,62,320 per 10 grams on a duty-inclusive basis, which lands within 0.2% of the live MCX quote of ₹1,62,097.
| International level | MCX-equivalent (₹/10g) | What it represents |
|---|---|---|
| $4,311.56 | ₹1,52,080 | 200-day EMA |
| $4,359.87 | ₹1,53,784 | 100-day EMA |
| $4,427.32 | ₹1,56,163 | 20-day EMA |
| $4,574.00 | ₹1,61,337 | Trend pivot |
| $4,601.87 | ₹1,62,320 | Spot |
| $4,769.00 | ₹1,68,215 | Major resistance band |
| $4,900.00 | ₹1,72,836 | Goldman year-end target |
| $6,000.00 | ₹2,11,635 | J.P. Morgan Q4 2026 target |
Conversions use a USD/INR rate of approximately ₹95.4 and a 15% customs duty, and exclude GST, dealer premium and making charges. Any change in the rupee or the duty structure moves every figure in this table, so the calculation should be re-run rather than carried forward.
Gold Price Prediction 2027 to 2031: Long-Term Outlook
The long term price outlook for gold rests on central bank demand. The World Gold Council 2026 survey found that 89% of reserve managers expect global central bank gold holdings to rise over the next 12 months, and a record 45% plan to add to their own reserves. Central banks accumulated an average of about 1,000 tonnes a year over the past four years, roughly double the pace of the prior decade.
Complicating the situation in 2026, Central banks sold 129 tonnes in the first quarter, led by a 60 tonne disposal from Turkey, and net reported purchases came to just 16 tonnes. Using London over-the-counter data and Swiss refinery flows, the World Gold Council estimates actual first-quarter buying was closer to 244 tonnes, up from 208 tonnes in the final quarter of 2025. Chinese net imports reached 317 tonnes in the first quarter, close to three times the previous quarter, and the People’s Bank of China lifted reported purchases from roughly one tonne a month to five tonnes in March and eight in April.
| Year | Conservative | Base case | Bullish case |
|---|---|---|---|
| 2026 (year-end) | $4,400 | $4,900 | $6,000 |
| 2027 | $4,000 | $4,800 | $6,300 |
| 2028 | $4,400 | $5,300 | $7,000 |
| 2029 | $4,800 | $5,900 | $7,800 |
| 2030 | $5,200 | $6,500 | $8,600 |
| 2031 | $5,600 | $7,100 | $9,500 |
The 2026 year-end row is anchored to published targets: the conservative figure is the Goldman Sachs scenario for a Fed that hikes, the base case is the Goldman year-end target, and the bullish figure is the J.P. Morgan Q4 2026 forecast. The 2027 bullish figure is J.P. Morgan’s published 2027 target. Rows from 2028 onward are scenario extrapolations anchored to those institutional ranges rather than published forecasts, and they illustrate trajectories rather than guarantees.
The conservative column broadly describes a world in which the Fed hikes and holds; the bullish column describes one in which it does not and central bank accumulation reaccelerates.
For the other half of the precious-metals trade, see the Silver Price Forecast.
Factors That Could Affect Gold Prices
- Federal Reserve policy and real interest rates: Higher real yields raise the opportunity cost of holding an asset that pays nothing, which is the single largest swing factor in every forecast above.
- The US dollar: A weaker dollar makes gold cheaper for buyers outside the United States. The dollar reaching a three-month low is the main reason gold has advanced through August.
- Oil and inflation: Expensive energy can support gold as an inflation hedge, but it also raises rate expectations, which works against it. The two effects frequently cancel out.
- Central bank and ETF demand: Sustained official-sector buying absorbs supply and sets a floor, while ETF outflows can amplify corrections when investor sentiment turns.
- Geopolitical risk: Conflict lifts safe-haven demand, though the effect is often offset when the same conflict drives energy prices and yields higher.
- India-specific factors: The rupee, the 15% import duty, GST, festive and wedding demand and dealer discounts all move the local price independently of the international one.
Physical Gold vs Tokenised Gold: XAU-USDT and PAXG on CoinDCX
Indian investors can take gold exposure through physical metal, gold ETFs, MCX futures or tokenised gold. Each carries a different ownership profile, and the differences matter more than they appear at first glance.
| Feature | Physical gold | MCX futures | Tokenised gold |
|---|---|---|---|
| Trading hours | Store hours | Fixed sessions | 24/7 |
| Minimum ticket | High | Lot-based | Fractional |
| Storage | Custody needed | Not applicable | No custody needed |
| Backing | Physical metal | Exchange contract | Varies by product |
PAX Gold is a token backed by allocated physical gold held by its issuer, so its price tracks spot gold closely. XAU-USDT and PAXG-USDT are perpetual futures pairs that track the gold price with leverage available, and they do not convey ownership of physical metal. Both trade around the clock on CoinDCX, an FIU-IND registered platform, which matters because the largest gold moves increasingly happen during US market hours when Indian exchanges are closed.
For portfolio context beyond precious metals, see the Bitcoin Price Prediction, and if you are new to the platform, here is how to buy crypto in India.
Gold Price History (2010 to 2024)
Gold has delivered steady long-term growth across decades, which reflects its role as a store of value rather than a fast-moving asset. Periods of economic expansion often bring temporary corrections, because investors rotate toward riskier assets during recoveries.
Major global crises usually push gold higher, since financial stress increases demand for safe-haven assets. Recessions and pandemics have repeatedly highlighted that defensive quality, and over long periods gold has preserved purchasing power effectively.
| Year | Average gold price (USD per ounce) |
|---|---|
| 2010 | 1,224 |
| 2012 | 1,668 |
| 2015 | 1,160 |
| 2018 | 1,268 |
| 2020 | 1,770 |
| 2021 | 1,799 |
| 2022 | 1,800 |
| 2023 | 1,940 |
| 2024 | 2,050 |
Quick insight from history: The table shows gradual long-term growth with regular short-term swings along the way. The move from roughly $2,050 in 2024 to the $4,600 area today is far steeper than anything in that fifteen-year record, which is worth holding in mind when reading the higher long-term targets in this article.
Conclusion
Gold has cleared the 38.2% retracement of its 2026 correction at $4,574 and reclaimed its long-term moving average, which puts the metal in a constructive position for the first time since the spring. The immediate gold price prediction stays range-bound between $4,574 and $4,769 until one of those levels breaks on a daily close. For the rest of 2026 the published range runs from roughly $4,400 to $6,000, and the gap between those two numbers is a disagreement about Federal Reserve policy rather than about gold.
In India, the rupee, the 15% import duty, GST and local discounts can change the final figure per 10 grams materially, which is why the conversion should be re-run rather than carried forward. Investors should also separate physical gold, gold-backed tokens and gold-linked perpetual futures, because each carries a different ownership and risk profile.
Disclaimer
This article is for informational purposes only and does not constitute investment advice. Gold, crypto assets and derivatives can be volatile. Commodity-linked perpetual futures are leveraged products and may result in rapid losses or liquidation. They do not give ownership of physical gold. Always conduct independent research and assess your financial situation and risk tolerance before investing or trading.
FAQs
Q1: Will gold prices rise in 2026?
Gold’s path for the rest of 2026 depends almost entirely on Federal Reserve policy, and published forecasts disagree sharply. J.P. Morgan expects an average of $6,000 in the fourth quarter, roughly 30% above the current price, while the late-July Reuters poll median of $4,509 and the LBMA survey average of $4,500 both sit slightly below spot. Gold has already passed the middle of that range, so the more useful question is whether it can clear the $4,769 resistance band rather than whether it rises at all.
Q2: Is now a good time to buy gold?
Gold suits long-term allocation better than short-term timing. The metal is 17.8% below its January record of $5,597, momentum has flattened with the RSI barely above its average, and the next resistance band sits about 3.6% above spot. Staggered purchases reduce the risk of committing at a single price near a technical test, while short-term traders face concentrated event risk around Federal Reserve decisions and inflation data.
Q3: Where will gold prices be in 2030?
Gold’s 2030 scenarios run from $5,200 in the conservative case to $6,500 in the base case and $8,600 in the bullish case. At the present rupee rate and duty structure those translate to roughly ₹1,83,400, ₹2,29,300 and ₹3,03,300 per 10 grams. Projections at this horizon depend on central bank accumulation, real interest rates and global debt levels, so they describe trajectories rather than targets.
Q4: Where will gold prices go in the next 5 years in India?
Indian gold prices track the international price adjusted for the rupee, the 15% import duty and GST, so the local figure can move even when the dollar price does not. Applying the base-case path to today’s rupee and duty structure gives roughly ₹1,69,300 per 10 grams in 2027 rising toward ₹2,29,300 by 2030. Festive and wedding demand adds seasonal support, while a stronger rupee would mute gains that look larger in dollar terms.
Q5: Should I invest in physical gold or digital gold?
Physical gold gives tangible ownership but carries storage, purity and making-charge costs that reduce the effective return. Digital and tokenised products offer transparent pricing, fractional purchases and no custody burden, though they introduce issuer or counterparty considerations of their own. The choice depends on whether the priority is holding the metal itself or tracking its price efficiently.
Q6. Why is gold falling?
Gold is not falling at present. The metal has advanced through August to trade near $4,602, roughly a three-month high, supported by a dollar at a three-month low and easing oil prices. The pressures that drove gold down earlier in 2026, mainly elevated interest rates and a strong dollar, have eased rather than disappeared, and a Federal Reserve hike remains the clearest path back to a declining price.
Q7. Will gold crash in 2026?
Gold crashing in 2026 is not the base case in any major published forecast, though sharp corrections remain possible. The most bearish credible scenario comes from Goldman Sachs, which sees $4,400 if the Federal Reserve delivers a rate hike, about 4.4% below the current price. Goldman’s central year-end target is $4,900 and J.P. Morgan’s fourth-quarter figure is $6,000, so the published range runs from a modest decline to a substantial gain.
Will gold reach ₹2 lakh per 10 grams?
Gold reaching ₹2 lakh per 10 grams would require the international price to reach roughly $5,670 on an MCX basis, or about $5,505 once GST is included, at the current ₹95.4 rupee rate and 15% duty. Both figures sit close to the all-time high of $5,597, which itself converts to about ₹1,97,400 per 10 grams today. J.P. Morgan’s $6,000 target would clear the mark, so ₹2 lakh is best understood as a record-high-equivalent level rather than a near-term expectation.
Q9. Will gold rate decrease in coming days in 2026?
Gold could ease in the coming sessions given how compressed momentum has become, with the RSI at 66.82 only 0.18 points above its average and the metal trading 0.89% below its own session high. The levels to watch are $4,574, which marks the trend pivot, and the 20-day EMA at $4,427 below it. Central bank and physical demand continue to provide a floor, which is why most institutions describe corrections rather than sustained declines.
Q10. Will gold cross ₹2 lakh in 2026?
Gold crossing ₹2 lakh per 10 grams before the end of 2026 would need a gain of about 23% from current Indian levels in roughly four months. That is possible only under the most bullish published scenario, in which gold reaches the J.P. Morgan target of $6,000. The Reuters poll and LBMA survey both point below the current price for year-end, so ₹2 lakh in 2026 sits well outside the central case.
Q11. Is XAU-USDT tokenized gold?
XAU-USDT is a gold-linked perpetual futures contract rather than a tokenised holding of gold. It provides derivative exposure to the gold price with leverage available and does not represent ownership of physical metal or of any gold-backed token.
Q12. What is the difference between PAXG spot and PAXG-USDT futures?
PAXG spot means holding the gold-backed token itself, subject to the issuer’s terms and redemption conditions. PAXG-USDT futures are derivatives linked to that token’s price and convey no ownership of PAXG or of the gold underlying it. The distinction matters for how each product behaves in a stressed market and for what happens to a leveraged position.
Q13. Will gold prices decrease in the coming days?
Gold prices could decrease if bond yields and the dollar rise together or the Federal Reserve signals tighter policy at or after Jackson Hole. The technical case for a pullback strengthens below $4,574, with the 20-day EMA at $4,427 as the next reference. Central bank and physical demand have repeatedly limited the downside during 2026.
Q14. Will gold rate decrease in coming days in 2027?
Gold’s 2027 outlook points higher rather than lower in most published research, though short-term corrections will still occur. J.P. Morgan forecasts an average of $6,263 across 2027, having trimmed that figure by 4.4% from its earlier estimate, while the Reuters poll puts the 2027 average nearer $4,610. The gap between those two numbers is the same Federal Reserve disagreement that drives the 2026 forecasts.
Q15. What will gold cost in 2028?
Gold in 2028 sits between $4,400 and $7,000 across the scenarios above, with a base case of $5,300 per ounce. Those figures convert to roughly ₹1,55,200 to ₹2,46,900 per 10 grams at the current rupee and duty structure. No major institution publishes a formal 2028 target, so these are extrapolations from the 2026 and 2027 institutional ranges.