
Arbitrum has broken out of its August base but was rejected at its 200-day EMA within hours, leaving momentum strong and structure unresolved. This Arbitrum crypto price prediction analyses ARB’s short-term outlook for today, this week, and September 2026, alongside long-term forecasts through 2040. Using RSI, MACD, and moving averages, the report highlights key support and resistance levels, potential price targets, and the broader market structure that could influence ARB’s future performance.
Arbitrum (ARB) is currently trading at $0.11040, up 0.93% after touching $0.12000 and being turned back at that level, as of 1 September 2026. The 14-day RSI stands at 70.19, tipping just past overbought and sitting 6.6 points above its moving average at 63.56, while the 20-day, 50-day, 100-day, and 200-day EMAs are positioned at $0.09147, $0.08757, $0.09144, and $0.11741, respectively. The MACD is positive and widening, indicating strong short-term momentum. Based on these technical indicators and broader market trends, ARB is expected to retest resistance near $0.11741 while holding support above $0.10728 in the near term.
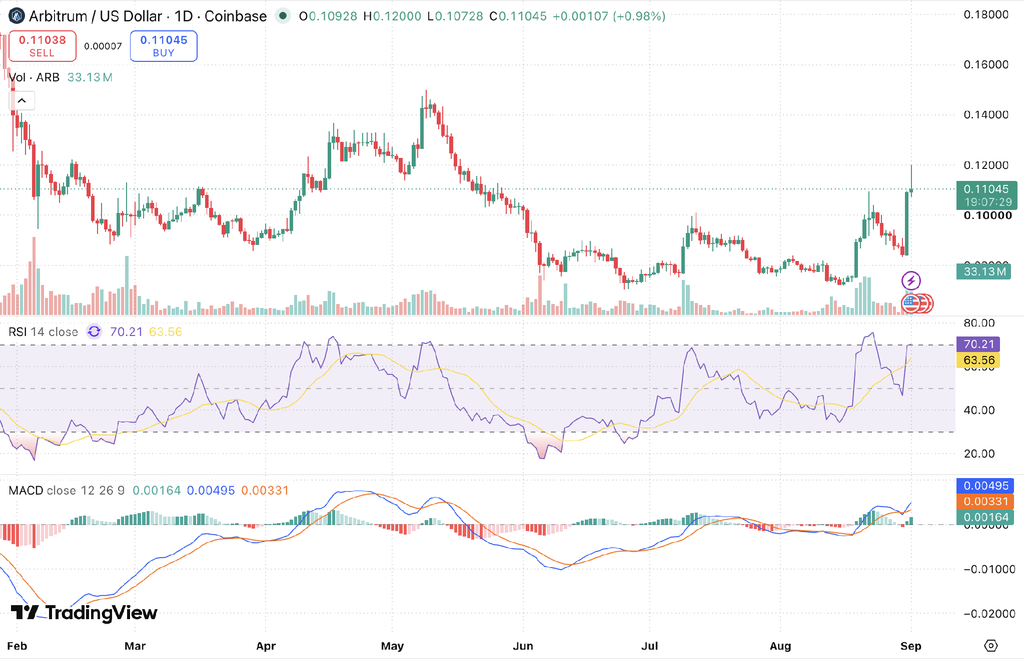
ARB/USD daily chart data sourced from TradingView
Key Insights
- Short-term outlook: ARB spiked to $0.12000 and was thrown back to $0.11040 in the same session, roughly 8% off the high. Support comes in at $0.10728 and again at $0.09800. On the upside, ARB has to clear $0.11741 to extend the move.
- Medium to long-term outlook: The 20-day EMA at $0.09147 has just edged above the 100-day EMA at $0.09144, the first bullish cross of that pair since May. For the remainder of 2026, ARB can work toward $0.13500-$0.15000 if it reclaims and holds the 200-day EMA. By 2030, sustained ecosystem growth could keep ARB in a broader $0.20-$0.35 range, although volatility is expected.
- Technical analysis: RSI has pushed into overbought at 70.19 and the MACD histogram is expanding at 0.00164 after a fresh bullish crossover. Price, however, still sits 6.0% below the 200-day EMA, so the trend change is not confirmed yet.
Trade ARB in INR on 
Deposit and withdraw in INR (₹).
No Conversion to Crypto Required.

Arbitrum Short-Term Price Prediction – Today, This Week, September 2026
Here is the Arbitrum coin price prediction 2026 for today, this week, and September 2026.
| Timeframe | Price Target | Support | Resistance | ROI |
|---|---|---|---|---|
| Next 24 Hrs | $0.11400 | $0.10728 | $0.11741 | +3.26% |
| This Week | $0.11741 | $0.10400 | $0.12000 | +6.35% |
| September 2026 | $0.12500 | $0.09800 | $0.13500 | +13.22% |
Arbitrum Token Price Prediction Today
Arbitrum is trading at $0.11040 and is expected to range between $0.10728 and $0.11741 in the next 24 hours. The RSI sits at 70.19 and the 20-EMA at $0.09147 is a long way below price, which confirms short-term momentum is intact but stretched. If ARB holds above $0.10728, the next test is $0.11741. Losing that floor opens the way down to $0.10400.
Arbitrum Coin Price Prediction for This Week
Arbitrum is projected to trade between $0.10400 and $0.12000 this week. ARB is 26.1% above the 50-day EMA at $0.08757, with the MACD histogram expanding to 0.00164, pointing to bullish momentum. ARB needs a weekly close above $0.11741 before $0.12000 comes back into range. If it slips under $0.10400 instead, the next level to watch is $0.09800.
Read more: How to buy Arbitrum (ARB) in India
Arbitrum Price Prediction for September 2026
Arbitrum’s September 2026 price prediction targets $0.12500, with a range of $0.09800-$0.13500. ARB is still 6.0% below its 200-day EMA at $0.11741, and the RSI at 70.19 signals overbought conditions after a near-vertical two-session move. A monthly close above $0.11741 would confirm the trend change heading into Q4 2026. Fail there and ARB spends the month between $0.09800 and $0.11741 instead.
Arbitrum Coin Price Prediction for October 2026
The Arbitrum token price prediction for October 2026 sits at $0.13500, within a range of $0.10500 to $0.14750, and it depends entirely on ARB having taken $0.11741 back and held it. Clearing that opens the $0.13000 to $0.14750 band where May’s breakdown began, and that is where the next real supply sits. Without the reclaim, October repeats September rather than extending it, with the 200-day EMA still capping the upside.
Arbitrum Price Prediction 2026 (Medium Term)
| Month | Price Target | Support | Resistance | ROI |
|---|---|---|---|---|
| Sep 2026 | $0.12500 | $0.09800 | $0.13500 | +13.22% |
| Oct 2026 | $0.13500 | $0.10500 | $0.14750 | +22.28% |
| Nov 2026 | $0.14000 | $0.11000 | $0.15500 | +26.81% |
| Dec 2026 | $0.15000 | $0.11700 | $0.16500 | +35.87% |
Arbitrum’s 2026 price range is projected at $0.09800-$0.16500. The 200-day EMA at $0.11741 is the key bull/bear line: a reclaim targets $0.15000 by December, while a failure to hold $0.09800 risks a slide back to $0.09147, where the 20-day and 100-day EMAs now sit almost on top of each other. Weekly MACD has turned positive again and RSI is trading well above the midline at 70.19.
Want to diversify beyond Arbitrum? Check out the Top 10 Cryptos To Invest In September 2026
Arbitrum Price Prediction 2027 to 2040 (Long Term)
The following forecasts are derived from network-adoption models, Layer-2 settlement growth on Ethereum, broader Bitcoin halving-cycle analysis, and historical ARB volatility patterns. They represent scenario ranges, not price targets.
| Year | Price Target | Support | Resistance | ROI |
|---|---|---|---|---|
| 2027 | $0.15500 | $0.11700 | $0.18500 | +40.40% |
| 2028 | $0.19000 | $0.14000 | $0.23000 | +72.10% |
| 2029 | $0.23000 | $0.17000 | $0.28000 | +108.33% |
| 2030 | $0.28000 | $0.20000 | $0.35000 | +153.62% |
| 2031 | $0.32000 | $0.23000 | $0.40000 | +189.86% |
| 2035 | $0.52000 | $0.36000 | $0.65000 | +371.01% |
| 2040 | $0.84000 | $0.58000 | $1.05000 | +660.87% |
Arbitrum 2030 Forecast: What Is the Expected Price?
Arbitrum price prediction 2030 targets $0.28000, within a range of $0.20000-$0.35000, fuelled by growing network adoption and improving market conditions. Unlike Bitcoin, ARB has no fixed emission schedule working in its favour, so the case rests on demand rather than scarcity: fee revenue routed back to the DAO, Orbit chain expansion, and rising total value locked have to grow faster than the remaining unlock schedule dilutes supply. Based on the current recovery structure, long-term trend continuation models support a range of $0.22000-$0.35000 under sustained ecosystem growth.
Arbitrum 2031 Outlook and Expected Price Range
The Arbitrum price outlook for 2031 targets $0.32000, with a range of $0.23000-$0.40000, as the market works through the digestion phase that has historically followed the Bitcoin halving cycle. ARB has no halving of its own, so this is a second-order effect transmitted through broader crypto liquidity rather than a supply event on Arbitrum. Cycle analysis suggests 2031 could mirror the 2029 pattern, either consolidating from a prior peak or building a new base. Long-term holder activity, unlock schedules, and liquidity trends will remain the key signals to monitor.
Arbitrum Price Prediction 2040: Long-Term Forecast
By 2040, Arbitrum’s price forecast models project $0.84000, ranging from $0.58000 to $1.05000. Long-term adoption and network effects could support that band, while more aggressive scenarios extend toward $1.30000. These forecasts carry high uncertainty over a 14-year horizon and should be interpreted as scenario ranges rather than fixed targets.
Arbitrum Technical Analysis
The following technical indicators were used to derive the Arbitrum price prediction above.
| Indicator | Value | Signal |
|---|---|---|
| Relative Strength Index (14-Day RSI) | 70.19 | Overbought, just past the 70 threshold |
| RSI Moving Average | 63.56 | RSI 6.6 points above it, bullish cross |
| 20-Day EMA | $0.09147 | Support, price 20.7% above |
| 50-Day EMA | $0.08757 | Still the lowest of the four, laggard |
| 100-Day EMA | $0.09144 | Just crossed from below by the 20-day EMA |
| 200-Day EMA | $0.11741 | Resistance, price 6.0% below |
| Trading Volume, session to date | 33.13M ARB | Candle roughly 20% complete |
Relative Strength Index (RSI)
The 14-day RSI is at 70.19, just past the overbought threshold, and sits 6.6 points above its moving average at 63.56. The catch is mid-August: RSI peaked in the mid-70s at this same $0.1104 price, so today’s lower reading is a mild negative divergence. A fall under 55 would mark the spike as a failed breakout and shift focus back to the $0.09147 EMA cluster.
Moving Averages – 20-Day, 50-Day, 100-Day and 200-Day EMA
ARB trades 20.7% above the 20-day EMA at $0.09147, 26.1% above the 50-day at $0.08757, and 20.7% above the 100-day at $0.09144. The exception is the one that matters: the 200-day EMA at $0.11741 is still 6.0% overhead, and the $0.12000 session high pierced it before price was sold straight back underneath. Beneath that, the 20-day has just crossed above the 100-day, the first bullish cross since May. Until the 50-day follows and price closes over $0.11741, this is a recovery attempt rather than a confirmed trend change.
MACD (Moving Average Convergence Divergence)
The MACD line is at 0.00495, above the signal at 0.00331, with the histogram expanding to 0.00164. The crossover is only two sessions old and the line sits at its highest since the early-May peak, so the June to July momentum reset has fully unwound. MACD lags a move that has already run 16% in two sessions, though, so a close back under $0.10728 with the histogram contracting is the warning to watch.
Volume Analysis
The session is roughly 20% complete with 33.13M ARB traded, already matching the previous full session’s turnover. Volume arrived with the push to $0.12000 rather than after it, which is the right sequence for a genuine breakout. What undercuts it is where price ended up: heavy turnover on a move handed straight back usually means supply met the bid at the 200-day EMA. If volume drains while price stays under $0.11741, the spike reads as distribution rather than accumulation.
Disclaimer
This article is for informational purposes only and does not constitute financial or investment advice. Digital asset markets are highly volatile and prices can change rapidly. Past performance is not indicative of future results. The price predictions above are based on technical and on-chain analysis and should not be construed as investment recommendations. Always conduct your own research before making any trading or investment decisions.
FAQs
Q1. What will Arbitrum be worth in 2026?
The base case puts ARB near $0.15000 by December 2026, within a 2026 range of $0.09800 to $0.16500. That outcome depends on ARB reclaiming its 200-day EMA at $0.11741, the level that rejected it on 1 September. If it keeps failing there, the year ends closer to the $0.09800 to $0.11741 band instead.
Q2. What will be the price of 1 ARB in 2030?
Most price prediction models place ARB’s price near $0.28000 in 2030, within a range of $0.20000 to $0.35000. The actual outcome depends on Layer-2 adoption, fee revenue flowing back to the DAO, and how much of the remaining token supply reaches the market. Long-term forecasts vary widely between analysts, so treat this as a scenario range rather than a fixed target.
Q3. Will the Arbitrum price ever hit $100?
At a 10 billion total supply, ARB at $100 implies a valuation larger than the entire crypto market today. The 2040 ceiling in this forecast is $1.05000, and even that assumes sustained Layer-2 dominance over 14 years. Treat $100 targets circulating online as unsupported.
Q4. Is Arbitrum a safe investment?
Arbitrum is backed by one of the most popular layer-2 scaling solutions on Ethereum, Arbitrum. Ever since its inception, crypto has gained immense attention. Therefore, the crypto could be considered a safe investment, provided deep research on the project and price movement analysis are carried out.
Q5. What was Arbitrum’s highest price?
Arbitrum (ARB) reached its all-time high of around $2.40 on 12 January 2024.
Q6. Will Arbitrum go up?
Arbitrum needs to clear $0.11741 to extend the move, a level that rejected it on 1 September after price tagged $0.12000. The near-term structure supports further upside, with price above the 20-day, 50-day, and 100-day EMAs and the MACD histogram expanding to 0.00164. With RSI already at 70.19, the more likely immediate path is consolidation between $0.10728 and $0.11741 before the next attempt.
Q7. Why is Arbitrum going up?
Two sessions of buying carried ARB from roughly $0.0950 to $0.12000. Part of that is technical: clearing the 20-day and 100-day EMAs in quick succession forced short positions to close, which amplifies a move well beyond the underlying buying. The rest is a broader risk-on bid across Layer-2 tokens, helped by the ArbOS 61 Elara upgrade activated on 20 August and a DAO treasury strategy that funds operations through yield rather than direct ARB sales.
Q8. Is Arbitrum a good investment in 2026?
Whether Arbitrum is a good investment in 2026 depends on your risk tolerance. The base case here puts ARB between $0.09800 and $0.16500 through the rest of the year, with the 200-day EMA at $0.11741 as the line separating a recovery from another failed rally. The immediate consideration is entry timing: RSI is at 70.19, price was rejected at the 200-day EMA within hours of touching it, and the June low at $0.07040 is still the structural floor if this breakout fails.
Q9. Where can I buy Arbitrum in India?
Indian traders can buy ARB directly on CoinDCX in INR, with no USD conversion, no international brokerage, and no currency risk from exchange rate fluctuation. ARB is available for spot purchase and as a trading pair on India’s FIU-IND registered digital asset exchange.