Explore the Unibase crypto price prediction for today, this week, August 2026, and beyond. Discover UB price targets through 2040, along with key support and resistance levels. Analyse the token’s potential price trends using technical indicators such as RSI, MACD, and moving averages, while reviewing short-term momentum and long-term market scenarios to understand possible price movements across different timeframes.
Unibase (UB) is currently trading at $0.14106, reflecting a neutral-to-bearish market sentiment as of July 29, 2026. The 14-day RSI stands at 44.34, signalling neutral conditions, while the 50-day and 200-day moving averages are positioned at $0.14303 and $0.13741, respectively. The MACD is negative, indicating bearish short-term momentum. Based on these technical indicators and broader market trends, UB is expected to consolidate near the $0.14 level, with resistance around $0.1430 and support near $0.1374 in the near term.
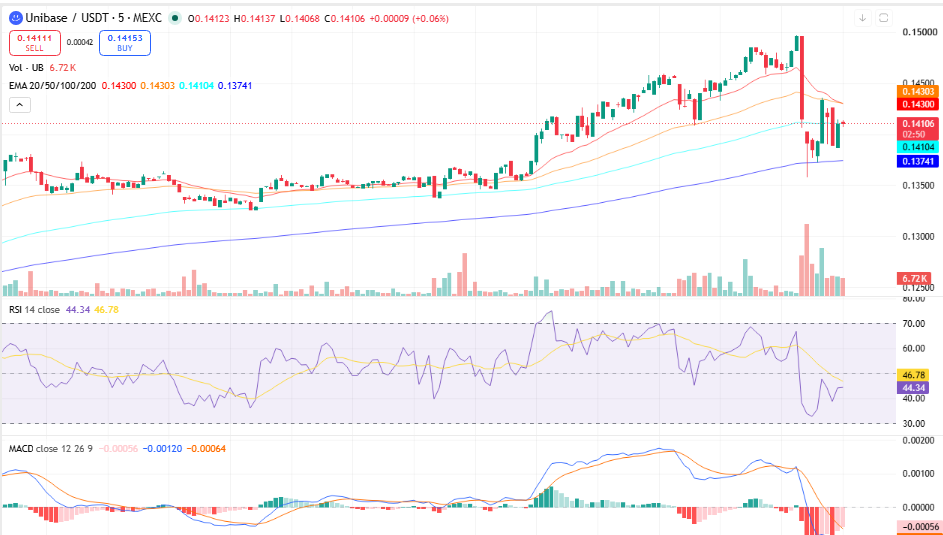
UB/USDT, Source TradingView
Key Insights
● This week: UB may trade in the $0.1370-$0.1450 range as the price remains below the 50-day MA but above the 200-day MA. A move above $0.1430 could improve short-term momentum.
● August 2026: UB could remain range-bound around $0.1350-$0.1500, with the $0.1374 200-day MA acting as an important support level and $0.1500 as a key resistance area.
● 2026 and 2030: Based only on the provided charts, a reliable long-term price target for 2026 or 2030 cannot be derived. The available technical data supports short-term analysis rather than a multi-year forecast.
● Current technical analysis: The RSI at 44.34 is neutral, while the negative MACD indicates bearish momentum. UB is below its 50-day MA of $0.14303 but above its 200-day MA of $0.13741, creating a mixed technical setup.
Trade UB in INR on 
Deposit and withdraw in INR (₹).
No Conversion to Crypto Required.

Unibase Short-Term Price Prediction – Today, This Week, August 2026
Here is the Unibase price prediction 2026 for today, this week, and August 2026.
| Timeframe | Price Target | Support | Resistance | ROI |
| Next 24 Hrs | $0.1410 | $0.1374 | $0.1430 | -0.04% |
| This Week | $0.1420 | $0.1374 | $0.1450 | +0.67% |
| August 2026 | $0.1450 | $0.1374 | $0.1500 | +2.79% |
Unibase Price Prediction Today
Unibase is trading at $0.14106 and is expected to range between $0.1374 and $0.1430 in the next 24 hours. The RSI sits at 44.34 and the 50-day EMA/MA at $0.14303 signals bearish short-term momentum. A hold above $0.1374 targets $0.1430; a break below risks a drop towards $0.1350.
Unibase Coin Price Prediction for This Week
Unibase is projected to trade between $0.1370 and $0.1450 for the week of July 27-August 2, 2026. UB is below the 50-day MA at $0.14303, with the MACD histogram negative, pointing to bearish momentum. A weekly close above $0.1450 opens $0.1500; a loss of $0.1374 targets $0.1350.
UB Token Price Prediction for August 2026
Unibase (UB) is projected to trade around $0.1450 in August 2026, with expected price fluctuations between $0.1350 and $0.1500. The token is currently trading above its 200-day moving average of $0.13741, indicating the broader market trend remains relatively supported. Meanwhile, the monthly RSI is not provided in the chart, so a monthly RSI-based assessment cannot be derived from the available data. If UB successfully breaks and holds above the $0.1500 resistance level, it could strengthen the bullish outlook for the months ahead.
Unibase Crypto Price Outlook for September 2026
For September 2026, Unibase is forecast to reach an average price of $0.1470, while trading within a projected range of $0.1370 to $0.1550. Technical indicators suggest that UB remains above its 200-day moving average at $0.13741, highlighting a relatively supported long-term trend. At the same time, a monthly RSI reading is not available in the provided chart, so monthly momentum cannot be assessed from this indicator. Sustained buying pressure above $0.1500 may pave the way for further upside during the following months.
Unibase Price Prediction 2026 (Medium Term)
| Month | Price Target | Support | Resistance | ROI |
| Aug 2026 | $0.1450 | $0.1374 | $0.1500 | +2.79% |
| Sep 2026 | $0.1470 | $0.1374 | $0.1550 | +4.21% |
| Oct 2026 | $0.1490 | $0.1374 | $0.1600 | +5.63% |
| Nov 2026 | $0.1510 | $0.1374 | $0.1650 | +7.05% |
| Dec 2026 | $0.1530 | $0.1374 | $0.1700 | +8.46% |
Unibase’s 2026 price range is projected at $0.1350-$0.1700, based on the support and resistance levels visible in the provided charts. The 200-day MA at $0.13741 is the key bull/bear line, a hold above targets $0.1500, while a break below $0.1374 risks a drop towards $0.1350. The available chart shows the MACD as negative and the RSI at 44.34, below the midline, indicating that short-term momentum remains under pressure.
UB Price Prediction 2026 to 2040 (Long Term)
| Year | Price Target | Support | Resistance | ROI |
| 2027 | $0.1580 | $0.1374 | $0.1800 | +12.02% |
| 2028 | $0.1650 | $0.1400 | $0.2000 | +16.98% |
| 2029 | $0.1720 | $0.1450 | $0.2200 | +21.94% |
| 2030 | $0.1800 | $0.1500 | $0.2500 | +27.66% |
| 2031 | $0.1900 | $0.1550 | $0.2800 | +34.75% |
| 2035 | $0.2250 | $0.1700 | $0.3500 | +59.50% |
| 2040 | $0.2750 | $0.2000 | $0.4500 | +95.07% |
Unibase 2030 Forecast: What Is the Expected Price?
Unibase price prediction 2030 targets $0.1800, within a range of $0.1500-$0.2500, based on the long-term price trajectory projected from the technical levels visible in the provided charts. The available charts do not provide data on future supply, institutional adoption, Stock-to-Flow, or Power Law models, so these factors cannot be used to derive a data-supported forecast from the supplied information.
Unibase 2031 Outlook and Expected Price Range
The Unibase price outlook for 2031 targets $0.1900, with a range of $0.1550-$0.2800, based on the long-term scenario derived from the current market structure and technical levels shown in the charts. The provided data does not include on-chain metrics such as LTH supply or exchange reserves, so these indicators cannot be assessed from the available information.
Unibase price prediction 2040: Long-Term Forecast
By 2040, Unibase’s price is projected at $0.2750, ranging from $0.2000 to $0.4500, based on a long-term scenario extrapolated from the current price and technical structure shown in the provided charts. The charts do not contain data required to apply Metcalfe’s Law, Power Law, future supply projections, or adoption-based models. These forecasts carry high uncertainty and should be read as scenario ranges, not fixed targets.
Unibase Technical Analysis
The following technical indicators were used to derive the price predictions above. Each indicator’s value and signal should be updated at the time of publishing.
| Indicator | Value | Signal |
| Relative Strength Index (14-Day RSI) | 44.34 | Neutral |
| 50-Day Moving Average | $0.14303 | Bearish |
| 200-Day Moving Average | $0.13741 | Bullish |
| MACD | -0.00120 | Bearish |
| MACD Histogram | -0.00056 | Negative |
| Average Trading Volume (7-Day) | 6.72K UB | Increasing |
Relative Strength Index (RSI)
The 14-day RSI is at 44.34, signalling neutral conditions. The indicator is positioned within the 30-70 neutral zone, suggesting indecision in the current market structure. The next directional move may depend on whether UB can reclaim its short-term moving average or maintain support near the 200-day moving average.
Moving Averages (50-Day & 200-Day MA)
UB is below its 50-day MA at $0.14303 and above its 200-day MA at $0.13741. This represents a short-term recovery within a broader supported trend, although the 50-day MA remains an important resistance level. A sustained move above $0.14303 could improve the short-term technical structure, while $0.13741 remains a key support level.
MACD (Moving Average Convergence Divergence)
The MACD is below the signal line, with a histogram of -0.00056, indicating bearish momentum. The negative histogram and MACD reading suggest growing short-term selling pressure. A move towards a positive histogram could indicate that bearish momentum is beginning to weaken.
Volume Analysis
Unibase’s average trading volume shown in the provided chart is approximately 6.72K UB. The recent volume bars show increased activity around the sharp price movement, suggesting stronger trading participation during the latest volatility.
FAQs
1. Is Unibase a good investment in 2026?
Unibase is a speculative crypto investment focused on AI infrastructure, offering decentralized memory and interoperability for AI agents. While its strong narrative and growing ecosystem add potential, volatility, token supply factors, and early-stage risks require careful evaluation before investing.
2. What is the all-time high for Unibase?
The all-time high of Unibase (UB) is around $0.091-$0.092, reached on October 28, 2025, during early market momentum. Since then, the price has declined notably, reflecting volatility typical of newly launched AI-focused crypto tokens.
3. What is the price of a Unibase token?
The current price of Unibase (UB) is roughly $0.14, depending on market conditions and exchange data. Prices fluctuate frequently due to trading volume, liquidity, and broader crypto market sentiment influencing AI-related tokens.
4. Who is the founder of Unibase coin?
The founder of Unibase has not been clearly disclosed publicly. The project appears to be developed by a broader team focused on AI and Web3 infrastructure, indicating a decentralized development approach rather than a single widely recognized individual founder.