Fluence crypto price prediction explores FLT price targets for today, this week, August 2026, and the long term through 2040. Using RSI, MACD and moving averages, this forecast examines potential support and resistance levels, short-term momentum and possible future price scenarios. Discover Fluence’s projected price ranges for 2026, 2030, 2031 and 2040, based on technical analysis and current market trends.
Fluence (FLT) is currently trading at $0.001980, reflecting a neutral-to-bearish market sentiment as of July 29, 2026. The 14-day RSI stands at 43.13, signalling neutral conditions with mild bearish momentum, while the 50-day and 200-day moving averages are positioned at approximately $0.002000 and $0.001844, respectively. The MACD is negative, indicating bearish short-term momentum. Based on these technical indicators, FLT is expected to consolidate near current levels, with $0.002000 acting as immediate resistance and $0.001844 as key long-term support.
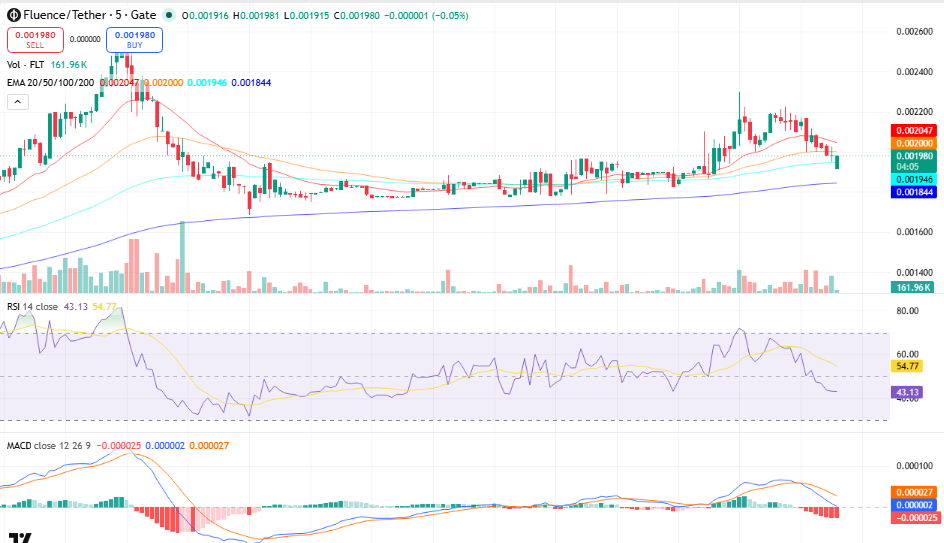
FLT/USDT, Source TradingView
Key Insights
● Short term: FLT could trade around $0.00195-$0.00205 this week and potentially move towards $0.00210 over the next month if buying pressure returns.
● 2026 outlook: Based on the current chart structure, FLT could remain range-bound, with a potential 2026 trading range of $0.00170-$0.00230. A sustained move above $0.002047 would improve the bullish setup.
● Long term & technicals: A 2030 price target cannot be reliably determined from the provided short-term chart alone. Currently, the RSI at 43.13 and negative MACD point to weakening momentum, while the 200-day MA near $0.001844 remains an important support level.
Fluence Short-Term Price Prediction – Today, This Week, August 2026
Here is the Fluence price prediction 2026 for today, this week, and August 2026.
| Timeframe | Price Target | Support | Resistance | ROI |
| Next 24 Hrs | $0.00198 | $0.00191 | $0.00205 | 0% |
| This Week | $0.00200 | $0.00188 | $0.00210 | +1.01% |
| August 2026 | $0.00205 | $0.00184 | $0.00220 | +3.54% |
Fluence Price Prediction Today
Fluence is trading at $0.001980 and is expected to range between $0.00191 and $0.00205 in the next 24 hours. The RSI sits at 43.13, while the 20-day EMA at approximately $0.002047 signals weak short-term momentum as FLT trades below this level. A hold above $0.00191 could target $0.00205; a break below risks a drop towards $0.00184.
Trade Crypto in INR on 
Deposit and withdraw in INR (₹).
No Conversion to Crypto Required.

Fluence Coin Price Prediction for This Week
Fluence is projected to trade between $0.00188 and $0.00210 for the week of July 27-August 2, 2026. FLT is below the 50-day moving average at approximately $0.002000, with the MACD histogram contracting into negative territory, pointing to bearish momentum. A weekly close above $0.002047 opens the path towards $0.00210; a loss of $0.00188 targets $0.00184.
Fluence Price Prediction for August 2026
Fluence (FLT) is projected to trade around $0.00205 in August 2026, with expected price fluctuations between $0.00184 and $0.00220. The token is currently trading above its 200-day moving average of approximately $0.001844, indicating that the broader chart structure remains supported despite recent weakness. Meanwhile, the monthly RSI is not provided in the chart, while the visible 14-day RSI at 43.13 reflects neutral-to-bearish momentum. If FLT successfully breaks and holds above the $0.002047 resistance level, it could strengthen the bullish outlook for the months ahead.
Fluence Coin Price Prediction for September 2026
For September 2026, Fluence is forecast to reach an average price of $0.00210, while trading within a projected range of $0.00185 to $0.00230. Technical indicators suggest that FLT remains above its 200-day moving average at approximately $0.001844, highlighting an underlying support zone. At the same time, a monthly RSI reading is not available from the provided chart, while the current 14-day RSI of 43.13 points to neutral-to-bearish market conditions. Sustained buying pressure above the $0.002047 resistance level may pave the way for further upside and reinforce investor confidence during the following months.
Fluence Price Prediction 2026 (Medium Term)
| Month | Price Target | Support | Resistance | ROI |
| Aug 2026 | $0.00205 | $0.00184 | $0.00220 | +3.54% |
| Sep 2026 | $0.00210 | $0.00185 | $0.00230 | +6.06% |
| Oct 2026 | $0.00215 | $0.00180 | $0.00235 | +8.59% |
| Nov 2026 | $0.00220 | $0.00175 | $0.00240 | +11.11% |
| Dec 2026 | $0.00225 | $0.00170 | $0.00245 | +13.64% |
Fluence’s 2026 price range is projected at $0.00170-$0.00245, based strictly on the support, resistance and moving-average structure visible in the provided charts. The 200-day MA at approximately $0.001844 is the key bull/bear line — a hold above this level could target $0.00220-$0.00245, while a break below $0.001844 risks a drop towards $0.00170. The visible MACD is negative and RSI at 43.13 is below the midline, indicating that short-term momentum remains cautious.
Fluence Price Prediction 2026 to 2040 (Long Term)
| Year | Price Target | Support | Resistance | ROI |
| 2027 | $0.00250 | $0.00190 | $0.00300 | +26.26% |
| 2028 | $0.00300 | $0.00220 | $0.00360 | +51.52% |
| 2029 | $0.00350 | $0.00260 | $0.00420 | +76.77% |
| 2030 | $0.00400 | $0.00300 | $0.00480 | +102.02% |
| 2031 | $0.00450 | $0.00330 | $0.00550 | +127.27% |
| 2035 | $0.00650 | $0.00450 | $0.00800 | +228.28% |
| 2040 | $0.01000 | $0.00650 | $0.01300 | +405.05% |
Fluence 2030 Forecast: What Is the Expected Price?
Fluence price prediction 2030 targets $0.00400, within a range of $0.00300-$0.00480, based on a long-term scenario derived from the current chart structure and the potential for gradual price appreciation. The current 200-day moving average near $0.001844 provides an important technical reference, while sustained movement above the $0.002047 resistance zone could support a broader long-term recovery. These estimates are scenario-based and do not rely on halving, institutional adoption, Stock-to-Flow or Power Law models, as these data points are not available in the provided charts.
Fluence 2031 Outlook and Expected Price Range
The Fluence price outlook for 2031 targets $0.00450, with a projected range of $0.00330-$0.00550, assuming the token maintains a gradual upward trajectory from the current price of $0.001980. The chart shows that FLT is currently above its 200-day moving average of approximately $0.001844, but below its shorter-term moving-average levels. A sustained move above $0.002047 could strengthen the recovery structure, while a breakdown below $0.001844 would weaken the long-term outlook.
Fluence price prediction 2040: Long-Term Forecast
By 2040, Fluence’s price is projected at $0.01000, ranging from $0.00650 to $0.01300, based on a high-uncertainty long-term scenario extrapolated from the current price and chart structure. The provided charts do not contain sufficient information to validate supply-based models, Metcalfe’s Law or Power Law projections, so these figures should be viewed only as scenario ranges rather than fixed targets. A sustained long-term trend above the current $0.001844 200-day moving average would be important for supporting this bullish scenario.
Fluence Technical Analysis
The following technical indicators were used to derive the price predictions above. Each indicator’s value and signal should be updated at the time of publishing.
| Indicator | Value | Signal |
| Relative Strength Index (14-Day RSI) | 43.13 | Neutral |
| 50-Day Moving Average | $0.002000 | Bearish |
| 200-Day Moving Average | $0.001844 | Bullish |
| MACD | 0.000002 | Bearish |
| MACD Histogram | -0.000025 | Negative |
| Average Trading Volume (7-Day) | $161.96K | Increasing |
Relative Strength Index (RSI)
The 14-day RSI is at 43.13, signalling neutral conditions. The reading sits within the 30-70 range, indicating that FLT is neither overbought nor oversold. However, the RSI remains below the midline, suggesting cautious momentum and leaving the next directional move dependent on renewed buying pressure or a broader market catalyst.
Moving Averages (50-Day & 200-Day MA)
FLT is below its 50-day moving average at approximately $0.002000 and above its 200-day moving average at approximately $0.001844. This reflects a short-term recovery within a broader supported structure, although the 50-day moving average is currently acting as resistance. A sustained move above $0.002000-$0.002047 could improve the short-term outlook, while $0.001844 remains key support.
MACD (Moving Average Convergence Divergence)
The MACD is below the signal line, with a histogram of approximately -0.000025, indicating bearish momentum. The negative histogram suggests growing short-term selling pressure. A bullish crossover accompanied by an expanding positive histogram could support further upside, while continued negative readings may keep FLT under pressure.
Volume Analysis
Fluence’s average daily trading volume over the past 7 days is approximately $161.96K. The chart shows recent increases in trading activity around the latest price movement, suggesting increasing participation, although the current bearish MACD structure indicates that the additional volume has not yet translated into sustained bullish momentum.
FAQs
Disclaimer: This article is for informational purposes only and does not constitute financial or investment advice. Crypto markets are highly volatile. Always do your own research (DYOR) before making any investment decisions.