

This guide provides a 0G (Zero Gravity) crypto price prediction using technical indicators such as RSI, MACD, and moving averages. Explore 0G price forecasts for today, this week, and the long term through 2040, along with key support and resistance levels, momentum analysis, and market outlook.
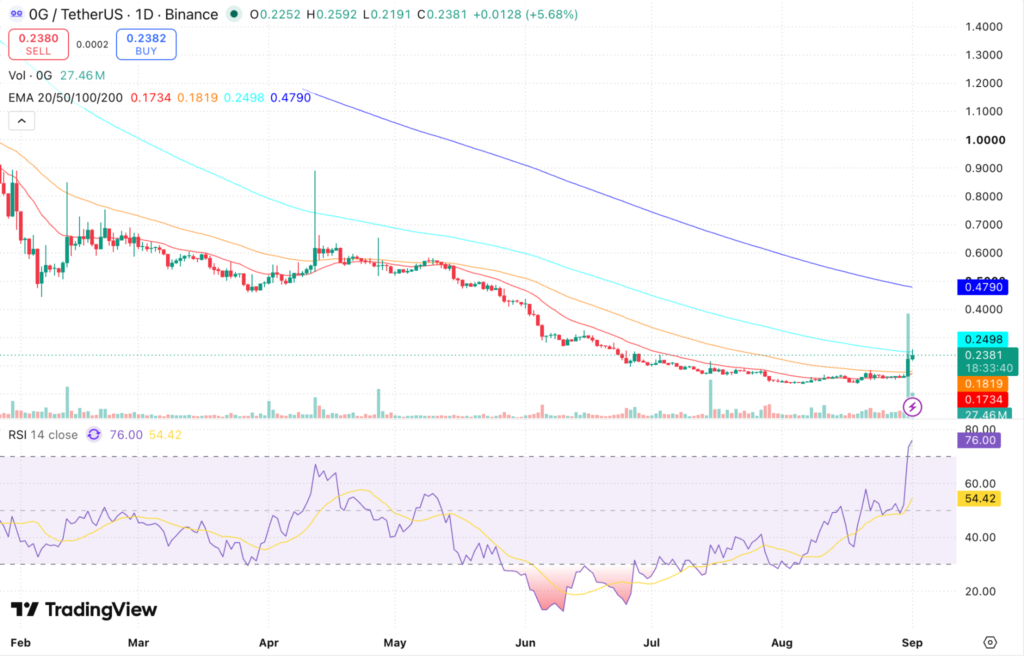
0G is currently trading near $0.2361, up 4.79% after running to $0.2592 and being turned back beneath its 100-day EMA, as per the latest TradingView chart. The 14-day RSI has surged to about 75.65 from the mid-50s and now sits 21.3 points above its moving average at 54.39, while the 20-day, 50-day, 100-day, and 200-day EMAs are positioned at $0.1734, $0.1819, $0.2498, and $0.4790, respectively. This is a decisive session, but the close came 8.9% off the session high, which leaves 0G pinned between the $0.2191 breakout base and the $0.2498 ceiling.
Key Insights
- Short-term outlook: 0G was rejected at $0.2592 and closed 8.9% off that high. Support sits at $0.2191, then the 50-day EMA at $0.1819, then the 20-day EMA at $0.1734, with $0.2498 the level to clear on the upside.
- Medium to long-term outlook: The 20-day EMA at $0.1734 is still $0.0085 beneath the 50-day EMA at $0.1819, so the short averages have not crossed bullishly yet. The 200-day EMA at $0.4790 is still falling and sits 50.7% above price, which is the distance this recovery has to cover before the trend itself changes.
- Technical analysis: The MACD histogram has expanded to 0.0080, with the line at 0.0100 crossing above the signal at 0.0020 and both reclaiming the zero line for the first time since May. RSI at 75.65 is deep in overbought territory. The two momentum readings now point in opposite directions while price holds its breakout.
Trade OG in INR on 
Deposit and withdraw in INR (₹).
No Conversion to Crypto Required.

0G Short-Term Price Prediction – Today, This Week, September 2026
Here is the 0G price prediction 2026 for today, this week, and September 2026.
| Timeframe | Price Target | Support | Resistance | ROI |
|---|---|---|---|---|
| Next 24 Hrs | $0.2450 | $0.2191 | $0.2498 | +3.77% |
| This Week | $0.2600 | $0.2191 | $0.2750 | +10.12% |
| September 2026 | $0.2900 | $0.1819 | $0.3200 | +22.83% |
0G Price Prediction Today
0G is trading near $0.2361 today, with a 24-hour target of $0.2450. The session low at $0.2191 is where buyers stepped in and is now acting as the floor, while the 100-day EMA at $0.2498 is the ceiling that turned the rally back earlier in the day. If 0G can close above $0.2450, the breakout stays intact and the run at $0.2498 remains live. Should $0.2191 give way instead, the next area buyers would need to defend is $0.1819, where the 50-day EMA sits.
0G Coin Price Prediction for This Week
Over the coming week, 0G is projected to trade between $0.2191 and $0.2750, with $0.2600 as the target. Everything hinges on the 100-day EMA at $0.2498, which has already rejected price once this session and will need a clean close above it before the next leg can develop. If that level holds as resistance and $0.2191 gives way instead, the 50-day EMA at $0.1819 comes back into play, and most of the two-session gain would be handed back.
0G Price Prediction for September 2026
For September 2026, 0G is targeting $0.2900 within a range that runs from $0.1819 to $0.3200. Because RSI is already overbought and the rally has been rejected once at $0.2592, the more realistic path through the month is a stretch of consolidation rather than an immediate breakout, which would give the short-term averages time to catch up to price. A monthly close above the 100-day EMA at $0.2498 would confirm that the August base has genuinely held. A drop back under $0.1819 would mean the sellers have reclaimed control.
0G Coin Price Prediction for October 2026
The October 2026 target for 0G is $0.3200, with a projected range of $0.2400 to $0.3600. Reaching it depends on 0G clearing $0.2498 and then holding above it, which would open up the $0.30 to $0.36 band where the June breakdown first accelerated and where the next meaningful block of supply is sitting. Should the 100-day EMA keep rejecting price instead, October is more likely to spend the month grinding between $0.1819 and $0.2498.
0G Price Prediction 2026 (Medium Term)
| Month | Price Target | Support | Resistance | ROI |
|---|---|---|---|---|
| Sep 2026 | $0.2900 | $0.1819 | $0.3200 | +22.83% |
| Oct 2026 | $0.3200 | $0.2400 | $0.3600 | +35.54% |
| Nov 2026 | $0.3600 | $0.2700 | $0.4200 | +52.48% |
| Dec 2026 | $0.4000 | $0.3000 | $0.4800 | +69.42% |
0G’s 2026 price range is projected at $0.182 to $0.480. The structure has improved over the past two sessions without being fully repaired, because the 20-day EMA at $0.1734 is still sitting $0.0085 below the 50-day EMA at $0.1819, which means the bullish sequence of averages beneath price has not formed yet. The level that ultimately defines whether this is a genuine trend change rather than a relief rally is the 200-day EMA at $0.4790, and price remains 50.7% below it.
Want to diversify beyond 0G? Check out the Top 10 Cryptos To Invest In September 2026
0G Price Prediction in INR (2026–2030)
For Indian traders, here is what the 0G price targets translate to in rupees.
| Period | 0G Target USD | 0G Price INR est. |
|---|---|---|
| September 2026 | $0.2900 | ₹27.67 |
| December 2026 | $0.4000 | ₹38.16 |
| 2027 | $0.5500 | ₹52.47 |
| 2030 | $1.4000 | ₹133.56 |
INR estimates based on a USD/INR rate of ~₹95.4. Rate fluctuations will affect actual INR values.
0G Long-Term Price Outlook (2027–2040)
The long-term outlook for 0G rests on three structural drivers: demand for decentralized AI infrastructure covering storage, data availability, and compute, the 2028 Bitcoin halving cycle’s indirect impact on the broader digital asset market, and corporate treasury interest in AI-focused tokens, already signalled by a $107M acquisition deal in the sector.
The following forecasts are derived from network-adoption models, broader Bitcoin halving-cycle analysis, and historical 0G volatility patterns. They represent scenario ranges, not price targets.
| Year | Price Target | Support | Resistance | ROI |
|---|---|---|---|---|
| 2027 | $0.5500 | $0.3000 | $0.8000 | +132.95% |
| 2028 | $0.8500 | $0.5000 | $1.2000 | +260.02% |
| 2029 | $1.1000 | $0.7000 | $1.6000 | +365.90% |
| 2030 | $1.4000 | $0.9000 | $2.1000 | +492.97% |
| 2031 | $1.8000 | $1.2000 | $2.7000 | +662.39% |
| 2035 | $3.2000 | $2.0000 | $4.8000 | +1,255.36% |
| 2040 | $5.0000 | $3.0000 | $8.0000 | +2,017.75% |
Where Will 0G Price Go in 2030?
0G’s 2030 price prediction targets $1.4000, within a range of $0.9000-$2.1000, supported by the broader post-2028 market cycle and the maturing of on-chain AI workloads. 0G has a fixed maximum supply of 1 billion tokens against roughly 213 million in circulation today, so the scarcity case rests on how much of that unlock schedule the network can absorb through genuine usage rather than on a hard ceiling alone. Adoption-based models built on storage utilisation, compute demand, and staking participation support this range under continued network growth.
Where Will 0G Price Go in 2031?
The 0G price prediction for 2031 targets $1.8000, with a range of $1.2000-$2.7000, as the market works through the digestion phase that has historically followed the Bitcoin halving cycle. 0G has no halving of its own, so this is a second-order effect transmitted through broader crypto liquidity rather than a supply event on the network. Cycle analysis suggests 2031 may either consolidate gains from a 2030 peak or build a new base. Validator participation, storage node counts, and exchange reserve trends will be the key on-chain signals to monitor.
Where Will 0G Price Go in 2040?
By 2040, 0G is projected at $5.0000, ranging from $3.0000 to $8.0000, as decentralized AI infrastructure either becomes standard plumbing or is displaced by centralised alternatives. Note that even the upper end of this range sits below the September 2025 all-time high of roughly $7.3, which reflects how much ground the token has to recover. Adoption-curve models point to $3.0000-$8.0000 under moderate adoption; more aggressive scenarios exceed $12.0000. These forecasts carry high uncertainty and should be read as scenario ranges, not fixed targets.
0G Technical Analysis
The following technical indicators were used to derive the 0G price prediction above.
| Indicator | Value | Signal |
|---|---|---|
| Relative Strength Index (14-Day RSI) | 75.65 | Overbought, up from the mid-50s |
| RSI Moving Average | 54.39 | RSI 21.3 points above it, sharp thrust |
| 20-Day EMA | $0.1734 | Support, price 36.2% above |
| 50-Day EMA | $0.1819 | Still $0.0085 above the 20-day EMA |
| 100-Day EMA | $0.2498 | Immediate resistance, price 5.5% below |
| 200-Day EMA | $0.4790 | Trend ceiling, price 50.7% below |
| Trading Volume, session to date | 28.36M 0G | Heaviest turnover of the year |
Relative Strength Index (RSI)
The 14-day RSI has surged to about 75.65 from the mid-50s and now sits 21.3 points above its moving average at 54.39. That is one of the widest gaps on the seven-month chart, and gaps that wide are a symptom of a single violent session rather than momentum building steadily. The reading is well over the overbought threshold of 70, so a period of cooling is the base case. A drift back toward 60 while price holds above $0.2191 would leave the 0G price prediction constructive. A fall under 50 would confirm the thrust has been sold and shift focus to the 50-day EMA at $0.1819.
Moving Averages – 20-Day, 50-Day, 100-Day and 200-Day EMA
0G trades above two of its four EMAs, sitting 36.2% above the 20-day EMA at $0.1734 and 29.8% above the 50-day EMA at $0.1819, while remaining 5.5% below the 100-day EMA at $0.2498 and 50.7% below the 200-day EMA at $0.4790. The development worth watching is the 20-day to 50-day spread, which has narrowed to $0.0085 with the 20-day still underneath. A cross there would be the first bullish alignment since the February decline began. The overextension caveat is real: a 36.2% premium to the 20-day EMA is not a level price sustains, and it closes either through consolidation or through a retracement toward the averages. The gap that actually matters is the 200-day, still 50.7% overhead, and closing it is what would complete a genuine trend reversal.
MACD (Moving Average Convergence Divergence)
The MACD histogram has expanded to 0.0080 and the pace has picked up sharply. The MACD line has lifted to 0.0100 while the signal line lags at 0.0020, leaving 0.0080 between them, and both have now reclaimed the zero line for the first time since May. That is the detail separating this move from the failed bounces in July and August, when the histogram flickered green but the lines stayed underwater. Momentum is not just decelerating in the downtrend; it has flipped, and that matters more than the absolute level. A sustained crossover alongside a break of $0.2498 would be the combination that turns a bounce into a genuine recovery.
Volume Analysis
The session is only around 24% complete and 28.36M 0G has already changed hands, which is the largest single bar on the entire seven-month chart and a multiple of the daily turnover that ran through August. Participation has flooded back into the range rather than draining out, and that cuts both ways. There is clear evidence of repositioning here, because volume this heavy off a five-month base does not happen without new money. There is also real distribution risk, because a close 8.9% off the high on this much turnover means someone was selling into the spike. Ranges that break on volume like this usually leave a durable low behind, so the $0.2191 level is the one to watch.
What Is the 0G Price Prediction for Indian Traders?
0G trades near ₹22.52 on CoinDCX in INR, with no USD conversion or international transfer required. Against the 2030 base case of ₹133.56, that is a potential 5.9x over four years, though it comes with the volatility of a token still roughly 97% below its all-time high. The near-term catalyst is continued ecosystem build-out across 0G’s storage, data availability, and compute layers. With RSI at 75.65 and price still capped at $0.2498, staged entries carry considerably less timing risk than a single purchase at these levels.
Disclaimer
This article is for informational purposes only and does not constitute financial or investment advice. Digital asset markets are highly volatile and prices can change rapidly. Past performance is not indicative of future results. The price predictions above are based on technical and on-chain analysis and should not be construed as investment recommendations. Always conduct your own research before making any trading or investment decisions.
FAQs
Q1. What will 1 0G be worth in 2030?
Based on the price prediction models used in this forecast, 0G is projected near $1.40 in 2030, within a range of $0.90 to $2.10. The actual outcome depends on adoption of decentralized AI infrastructure, staking demand, and how much of the token unlock schedule the network can absorb. Long-term forecasts vary widely between analysts, so treat this as a scenario range rather than a fixed target.
Q2. Will 0G reach $1?
Long-term price forecast models place 0G near $0.85 by 2028 and $1.10 by 2029, which puts $1 in the 2028 to 2029 window under the base case. From the current price of $0.2361 that is a gain of roughly 4.2x. Whether 0G gets there sooner depends on ecosystem adoption, institutional inflows, and overall crypto market cycles.
Q3. Is 0G a good investment?
0G (Zero Gravity) is typically viewed as a speculative, cutting-edge crypto investment. The project focuses on developing decentralized AI infrastructure, including modular storage, data availability, compute, and AI-native blockchain services. Some investors are convinced of the significant potential of AI-focused blockchain solutions. However, 0G is still in its infancy, its price is highly volatile, and it currently trades around 97% below its all-time high. Only investors who understand the risks of early-stage technology development and strongly believe in 0G’s vision should invest.
Q4. Will 0G go up?
0G is unlikely to move higher in the immediate term, because it first needs to clear $0.2498, the 100-day EMA, and it was rejected there this session. The setup has improved, with price now above the 20-day and 50-day EMAs and MACD back above zero. However, RSI at 75.65 is overbought and the 20-day EMA is still below the 50-day, which makes consolidation between $0.2191 and $0.2498 the likelier near-term path before any sustained move higher.
Q5. Why is 0G going up?
0G is rising largely because short sellers were forced to close their positions when the token reclaimed its 20-day and 50-day EMAs in a single session after five months of decline, which made the bounce larger than the underlying buying. Beyond that trigger, 0G tends to rise when investor demand picks up, when network usage such as storage and compute activity grows, or when there is positive news around AI infrastructure adoption.
Q6. What is the all-time high for 0G?
0G’s all-time high was about $7.3 in September 2025, when the market was very enthusiastic about AI-related crypto projects. The token now trades roughly 97% below that level after a prolonged decline through the first half of 2026. Traders often compare future 0G price predictions to this ATH level to assess potential upside.
Q7. Is 0G dead?
No, 0G is not dead, though the price action through 2026 has been severe. The network continues to operate as an AI-focused Layer 1 with storage, data availability, and compute layers, and it retains a circulating supply of roughly 213 million tokens against a $49M market capitalization. The heaviest volume session of the year, recorded this week, suggests participation is returning rather than leaving.
Q8. How high will 0G go in 5 years?
By 2031, the current forecasts place 0G near $1.80, within a range of $1.20 to $2.70. If macro conditions support continued AI infrastructure adoption through the late 2020s, the upper end of that range is achievable. The 2028 Bitcoin halving cycle is the key structural catalyst to watch between now and then.
Q9. Will 0G recover from the bear market?
0G has started to recover, but the move is not yet confirmed. The token has reclaimed its 20-day and 50-day EMAs, and MACD has crossed above the zero line for the first time since May, which together are the first constructive signals in months. It has still not reclaimed the 100-day EMA at $0.2498 or the 200-day EMA at $0.4790, and the 200-day EMA is the marker most commonly used to separate a bear phase from a genuine recovery. The immediate test is whether the price can hold above $0.2191 instead of falling straight back beneath it.
Q10. Who is the founder of 0G coin?
0G was founded by a team of technologists and industry experts, including Michael Heinrich (Co-Founder & CEO), Ming Wu (Co-Founder & CTO), Fan Long (Co-Founder & Chief Strategy & Security Officer), and Thomas Yao (Co-Founder & Chief Business Officer). The team has backgrounds in distributed systems, security research, AI infrastructure, and blockchain development.