
This guide provides a Hemi crypto price prediction using technical indicators such as RSI, MACD, and moving averages. Explore HEMI price forecasts for today, this week, and the long term through 2040, along with key support and resistance levels, momentum analysis, and market outlook.
Hemi (HEMI) is currently trading near $0.0201, up 35.81% after opening at $0.014787 and running to $0.020875, its highest print in seven months, as per the latest TradingView chart. The 14-day RSI has climbed to 80.71 and now sits 10.7 points above its moving average at 70.00, while the 20-day, 50-day, 100-day, and 200-day EMAs are positioned at $0.011273, $0.008410, $0.007568, and $0.011517, respectively. This is the follow-through the momentum readings had been building toward, and it arrived with the MACD histogram widening to 0.000895, the largest reading of the entire advance. The turnover behind it is the weaker half of the picture: the session has traded 3.93B HEMI with roughly three-quarters of the candle still to run.
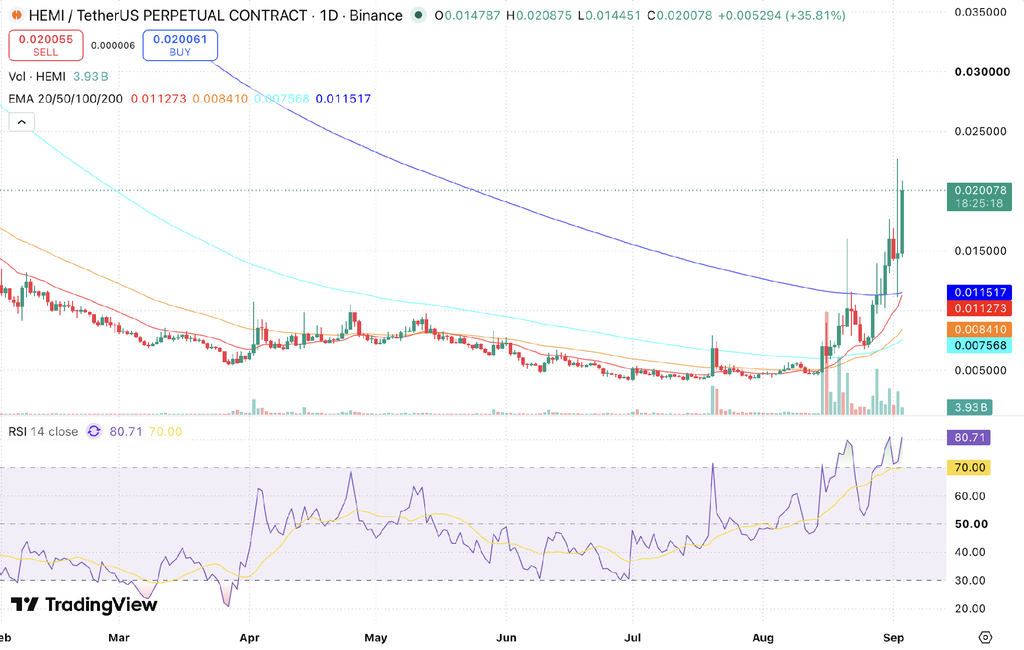
HEMI/USDT daily chart data sourced from TradingView
Key Insights
- Short-term outlook: HEMI cleared $0.0160 and printed a session high of $0.020875 before trading back to $0.020078, in the top quarter of the range. Support sits at $0.0160, then the session opens at $0.0148, with $0.0227 being the level to reclaim on the upside.
- Medium to long-term outlook: The 50-day EMA at $0.008410 crossed above the 100-day EMA at $0.007568 four sessions ago and has already opened a $0.000842 gap. The 20-day EMA at $0.011273 has closed to within $0.000244 of the 200-day EMA at $0.011517, and a cross there would complete the bullish stack.
- Technical analysis: The MACD has held its bullish crossover, with the line at 0.002749 above the signal at 0.001854 and the histogram positive at 0.000895. RSI at 80.71 is deep in overbought and has stalled at the same level as the 1 September peak of about 81.0, even though price has made a far higher high.
Trade HEMI in INR on 
Deposit and withdraw in INR (₹).
No Conversion to Crypto Required.

Hemi Short-Term Price Prediction: Today, This Week, September 2026
Here is the HEMI price prediction 2026 for today, this week, and September 2026.
| Timeframe | Price Target | Support | Resistance | ROI |
| Next 24 Hrs | $0.0209 | $0.0160 | $0.0227 | +4.09% |
| This Week | $0.0227 | $0.0148 | $0.0250 | +13.06% |
| September 2026 | $0.0250 | $0.0148 | $0.0300 | +24.52% |
Hemi Price Prediction Today
Hemi is trading near $0.0201 with a 24-hour target of $0.0209, the level where the session high formed. Support beneath that runs to $0.0160, the top of the range the previous three sessions closed within, and resistance sits at $0.0227, the spike high that was rejected yesterday. A close above $0.0209 would put $0.0227 back in play, while a loss of $0.0160 would open the way toward the session open at $0.0148.
Hemi Coin Price Prediction for This Week
HEMI is projected to trade between $0.0148 and $0.0250 this week, with a target of $0.0227. Clearing $0.0227 is the single requirement to confirm the breakout, and price has now built a higher low at $0.014451 after yesterday’s washout to $0.0111. Losing $0.0148 would put the 200-day EMA at $0.011517 in play.
| Read more: Hemi settles on Bitcoin, so track the Bitcoin Price Prediction alongside it |
Hemi Token Price Prediction for September 2026
HEMI September 2026 target is $0.0250, with a range of $0.0148 to $0.0300. With the MACD histogram at its widest of the run and price above all four EMAs, the realistic outcome is a second attempt at $0.0227 before any sustained move higher. A monthly close above $0.0227 would show the rejection there has been absorbed; a drop under $0.0148 would end the breakout.
Hemi Coin Price Prediction for October 2026
October 2026 moves the target for Hemi token price up to $0.0290, with a range of $0.0227 to $0.0350. Getting there requires HEMI to reclaim $0.0227 and hold it, which opens the $0.030 to $0.035 band. The 200-day EMA was still sitting above $0.030 as recently as March, so that area marks the first shelf of supply left over from the decline. If the move stalls instead, October ranges between $0.0148 and $0.0227.
Hemi Price Prediction 2026 (Medium Term)
| Month | Price Target | Support | Resistance | ROI |
| Sep 2026 | $0.0250 | $0.0148 | $0.0300 | +24.52% |
| Oct 2026 | $0.0290 | $0.0227 | $0.0350 | +44.44% |
| Nov 2026 | $0.0320 | $0.0250 | $0.0380 | +59.38% |
| Dec 2026 | $0.0350 | $0.0270 | $0.0420 | +74.32% |
Hemi’s 2026 price range is projected at $0.0148 to $0.0420. The structure has turned through this rally: the 50-day EMA at $0.008410 crossed above the 100-day EMA at $0.007568 four sessions ago and the gap has already opened to $0.000842, so the bullish sequence beneath price is widening rather than stalling. The 20-day EMA at $0.011273 has closed to within $0.000244 of the 200-day EMA at $0.011517, which is the last cross left to complete. The 200-day EMA remains the floor that defines whether the trend change holds, and price sits 74.3% above it.
| Want to diversify beyond Hemi? Check out the Top 10 Cryptos To Invest In 2026 |
Hemi Price Prediction in INR (2026-2030)
For Indian traders, here is what the HEMI price targets translate to in rupees.
| Period | HEMI Target USD | HEMI Price INR est. |
| September 2026 | $0.0250 | ₹2.39 |
| December 2026 | $0.0350 | ₹3.34 |
| 2027 | $0.0450 | ₹4.29 |
| 2030 | $0.1300 | ₹12.40 |
INR estimates based on a USD/INR rate of ~₹95.4. Rate fluctuations will affect actual INR values.
Hemi Long-Term Price Outlook (2027-2040)
The long-term outlook for HEMI rests on three structural drivers: adoption of its Bitcoin-Ethereum supernetwork architecture, the 2028 Bitcoin halving cycle’s indirect impact on the wider Bitcoin DeFi market, and the pace at which the veHEMI economic model converts protocol fees into staking rewards and burns.
The following forecasts are derived from network-adoption models, broader Bitcoin halving-cycle analysis, and historical HEMI volatility patterns. They represent scenario ranges, not price targets.
| Year | Price Target | Support | Resistance | ROI |
| 2027 | $0.0450 | $0.0250 | $0.0700 | +124.12% |
| 2028 | $0.0700 | $0.0400 | $0.1100 | +248.64% |
| 2029 | $0.0950 | $0.0600 | $0.1500 | +373.15% |
| 2030 | $0.1300 | $0.0850 | $0.2000 | +547.47% |
| 2031 | $0.1500 | $0.1000 | $0.2300 | +647.08% |
| 2035 | $0.2400 | $0.1500 | $0.3800 | +1,095.33% |
| 2040 | $0.3500 | $0.2200 | $0.5500 | +1,643.20% |
Where Will Hemi Price Go in 2030?
Hemi’s 2030 price prediction targets $0.130, within a range of $0.085-$0.200, supported by the post-2028 market cycle and continued growth in Bitcoin DeFi. The binding constraint is supply rather than demand: only about 978 million of the 10 billion HEMI are circulating, so a market cap near $19.6 million sits against a fully diluted valuation of roughly $201 million. Reaching $0.130 with the full supply outstanding implies a $1.3 billion valuation, which requires the veHEMI burn and staking lock-ups to absorb a meaningful share of the supply that unlocks between now and then.
Where Will Hemi Price Go in 2031?
The Hemi price prediction for 2031 targets $0.150, with a range of $0.100-$0.230, as the market works through the digestion phase that has historically followed the Bitcoin halving cycle. Hemi has no halving of its own, so this is a second-order effect transmitted through Bitcoin liquidity rather than a supply event on the network. Cycle analysis suggests 2031 may either consolidate gains from a 2030 peak or build a new base. Staked HEMI, protocol fee revenue, and total value locked will be the on-chain signals to monitor.
Where Will Hemi Price Go in 2040?
By 2040, Hemi’s price is projected at $0.350, ranging from $0.220 to $0.550, as the token’s emission schedule completes and network adoption matures. Adoption-curve models point to $0.30-$0.55 under moderate growth; more aggressive scenarios that assume Hemi becomes a default settlement layer for Bitcoin DeFi exceed $0.80. These forecasts carry high uncertainty and should be read as scenario ranges, not fixed targets.
Hemi Technical Analysis
The following technical indicators were used to derive the Hemi price prediction above.
| Indicator | Value | Signal |
| Relative Strength Index (14-Day RSI) | 80.71 | Overbought, level with the 1 Sep peak of 81.0 |
| RSI Moving Average | 70.00 | RSI now 10.7 points above it |
| 20-Day EMA | $0.011273 | Support, price 78.1% above |
| 50-Day EMA | $0.008410 | Now $0.000842 above the 100-day EMA |
| 100-Day EMA | $0.007568 | Bullish sequence widening |
| 200-Day EMA | $0.011517 | Breakout floor, price 74.3% above |
| Trading Volume, session to date | 3.93B HEMI | Candle roughly 23% complete |
Relative Strength Index (RSI)
The 14-day RSI is at 80.71 and has closed above 70 in nine of the past fourteen sessions. It sits 10.7 points above its moving average at 70.00, up from 2.4 points a session ago, so the buying has been packed into a very short window. RSI has also stalled just under its 1 September peak of 81.0 while price climbed from $0.0160 to $0.0201, which usually means fewer buyers are carrying the move. Above 70 with $0.0160 holding, the Hemi price prediction stays constructive. Under 50, the 200-day EMA at $0.011517 comes into play.
Moving Averages: 20-Day, 50-Day, 100-Day and 200-Day EMA
HEMI trades above all four EMAs: 78.1% above the 20-day at $0.011273, 138.7% above the 50-day at $0.008410, 165.3% above the 100-day at $0.007568, and 74.3% above the 200-day at $0.011517. The 20-day to 200-day spread has narrowed to $0.000244 and is a session or two from crossing. The 50-day crossed the 100-day four sessions ago and has opened a $0.000842 gap since, so that cross is widening instead of stalling. The premium cuts the other way. No trend holds a 78.1% stretch above its 20-day EMA for long, and it leaves the nearest average too far below price to trade against. Mean reversion targets $0.0160 first, then $0.0148.
Volume Analysis
The session is 23% done with 3.93B HEMI traded, a little ahead of yesterday’s pace. That is thinner than the price move suggests. A 35.81% advance is running on turnover close to a normal session, not the expansion behind the mid-August breakout, which still holds the heaviest bars on the chart. Price rising on volume that does not confirm is how spike tops form, and yesterday’s rejection from $0.0227 showed it. The structure underneath is better: HEMI has closed higher in eight of the last nine sessions and built a higher low at $0.014451 after the drop to $0.0111.
What Is the Hemi Price Prediction for Indian Traders?
HEMI translates to roughly ₹1.92 at current rates. Against the 2030 base case of ₹12.40, that is a potential 6.5x over four years, although the size of that multiple is a function of how far the token has already fallen: HEMI still trades 89.5% below its September 2025 all-time high of $0.1915. The near-term catalyst is Phase 2 of the Hemi economic model, which adds a Short-Term Pool and a Protocol-Owned Liquidity treasury and is targeted for later this year. With RSI at 80.71 and price 78.1% above its 20-day EMA, the timing risk here is the highest it has been in the move, so staged entries into a retracement toward $0.0160 carry less short-term risk than chasing the candle.
Disclaimer
This article is for informational purposes only and does not constitute financial or investment advice. Digital asset markets are highly volatile and prices can change rapidly. Past performance is not indicative of future results. The price predictions above are based on technical and on-chain analysis and should not be construed as investment recommendations. Always conduct your own research before making any trading or investment decisions.
FAQs
Q1. What will 1 HEMI be worth in 2030?
1 HEMI is projected to be worth about $0.130 in 2030, within a range of $0.085 to $0.200. Where it lands inside that range depends on Bitcoin DeFi adoption, how much supply gets locked through veHEMI staking, and how much of the 10 billion total supply is circulating by then.
Q2. What will Hemi be worth in 2040?
Long-term adoption models place HEMI near $0.350 by 2040, within a range of $0.220 to $0.550. These are high-uncertainty scenario ranges over a 14-year horizon and depend heavily on Hemi holding a leading position among Bitcoin programmability layers.
Q3. Will Hemi hit $1?
Hemi will not hit $1 under the base case used here, which places HEMI near $0.350 by 2040. At $1 with the full $10 billion supply outstanding, Hemi would carry a $10 billion valuation, roughly fifty times its current fully diluted value of about $201 million. That would require Hemi to become the dominant settlement layer for Bitcoin DeFi rather than one of several competing Layer-2 networks.
Q4. Is Hemi a good investment in 2026?
No, Hemi is not a good investment at $0.0201. RSI is at 80.71 and price sits 78.1% above its 20-day EMA, so a pullback toward $0.0160 is the better entry. The case for owning HEMI at all is the network, which is in far better shape than the token, with over $300 million in total value locked and more than 60,000 accounts. This forecast puts HEMI between $0.0148 and $0.0420 for the rest of 2026.
Q5. Will Hemi go up?
Hemi can go up, but it has to reclaim $0.0227 to confirm the breakout and hold above $0.0160 to keep the near-term structure intact. Price is above all four EMAs, the MACD histogram is at its widest of the run, and the 20-day EMA is about to cross the 200-day. Working against that, HEMI is 78.1% above its 20-day EMA with an RSI of 80.71, so a retracement toward $0.0160 is the more likely first move, with the session open at $0.0148 beneath that.
Q6. Why is Hemi going up?
Hemi is going up on a run of network news through August: a sequencer fix after the June mainnet outage, a native decentralised identity integration, a new community staking rewards cycle, and the first public preview of the reworked veHEMI staking system. Short covering has added to it. HEMI cleared its 20-day EMA and reached the 200-day inside a fortnight, which forces short positions to close and pushes a breakout further than the buying alone would.
Q7. What is the Hemi coin listing date?
The Hemi coin listing date was 29 August 2025, when the Token Generation Event went live and HEMI became tradable on major centralised exchanges with an initial supply of 10 billion tokens. The Hemi mainnet itself had gone live earlier, on 12 March 2025, so the network ran for roughly five months before the token existed. HEMI hit its all-time high of $0.1915 less than a month after listing and has traded below that level since.
Q8. What is Hemi’s all-time high (ATH)?
Hemi (HEMI) reached its all-time high of around $0.1915 on 24 September 2025, in the weeks following its token launch. At $0.0201 the token trades roughly 89.5% below that peak. Traders often compare future Hemi price predictions to this ATH level to assess potential upside.
Q9. How many HEMI coins are there?
Hemi has a maximum supply of 10 billion HEMI, of which roughly 978 million tokens, about 9.8%, are currently in circulation. Allocations to investors, the team, and the foundation vest over the next few years, so circulating supply will rise substantially.
Q10. Where can I buy Hemi in India?
You can buy Hemi in India on CoinDCX. Create an account, complete KYC, add funds by UPI or bank transfer, then search for HEMI and place your order. HEMI/USDT remains the most active pair by volume globally, so it is the reference price most quotes track.