
This guide provides a Pi Network crypto price prediction using technical indicators such as the Relative Strength Index (RSI), exponential moving averages (EMAs), volume profiles, and key chart structures. Explore PI price forecasts for today, this week, and the long term through 2040, along with critical support and resistance levels, momentum analysis, and market outlook. Whether tracking short-term price action or evaluating future potential, this forecast offers a data-driven view of Pi Network’s expected performance.
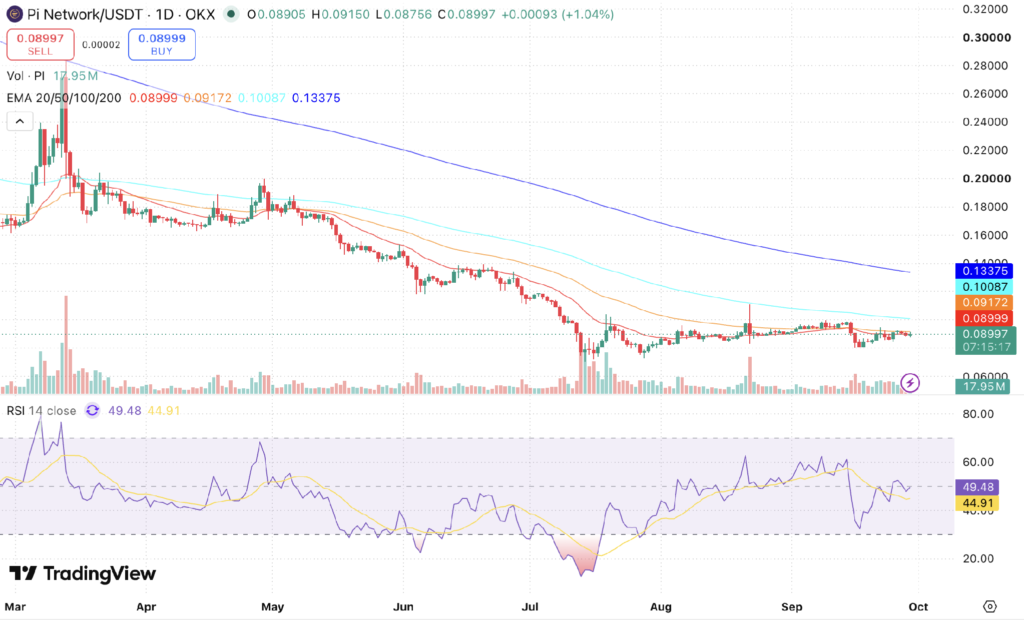
Pi Network (PI) is currently trading near $0.0900, sitting directly on its 20-day EMA, as per the latest daily chart. The 14-day RSI is at 49.48 against its 14-day moving average of 44.91, while the 20-day, 50-day, 100-day, and 200-day EMAs are positioned at $0.08999, $0.09172, $0.10087, and $0.13375, respectively. The daily session spanned a 4.5% range between $0.08756 and $0.09150 and is up 1.04%, though the high fell 0.24% short of reaching the 50-day EMA. Trading volume stands at 17.95 million PI with several hours remaining in the session. Based on this technical setup, PI is positioned to defend intermediate support at the 20-day EMA ($0.08999) while attempting to produce a confirmed closing breakout above the 50-day EMA ($0.09172).
Key Insights
- Short-term outlook: PI is balanced on the 20-day EMA at $0.08999, trading 0.02% under it and 1.91% below the 50-day EMA at $0.09172 after a 4.50% session between $0.08756 and $0.09150. The high stopped just short of the 50-day, so holding $0.0900 into October is the immediate requirement.
- Medium to long-term outlook: For the PI price prediction 2026, the gap to the 100-day EMA at $0.10087 stands at 10.81%, and that average is still falling toward price. Clearing the 50-day EMA at $0.09172 on a daily close is the necessary prerequisite to test the 100-day line, while the descending 200-day EMA at $0.13375 serves as the macro ceiling and December objective.
- Technical analysis: RSI at 49.5 holds 4.6 points above its moving average at 44.9, so last week’s bullish crossover is intact, though the reading has slipped just under the 50 midline. The 20-day EMA is 1.92% under the 50-day, down from 2.04%, so the bearish crossover keeps closing. Volume at 17.95M is running ahead of recent sessions.
Trade Crypto in INR on 
Deposit and withdraw in INR (₹).
No Conversion to Crypto Required.

Pi Network Short-Term Price Prediction – Today, This Week, October 2026
Here is the PI price prediction 2026 for today, this week, and October 2026.
| Timeframe | Price Target | Support | Resistance | ROI |
|---|---|---|---|---|
| Next 24 Hrs | $0.0905 | $0.0876 | $0.0917 | +0.59% |
| This Week | $0.0917 | $0.0868 | $0.0950 | +1.92% |
| October 2026 | $0.1009 | $0.0800 | $0.1150 | +12.15% |
Read more: How to buy Pi coin in India
Pi Network Price Prediction Today
PI is forecast to close today near $0.0905, holding a $0.0876 to $0.0917 range. The 20-day EMA at $0.08999 is the pivot, with price 0.02% under it after a 4.50% swing off the $0.08756 low, so the average that acted as resistance through mid-September is now the line the session is balancing on. The 50-day EMA at $0.09172 caps the upside, and a close below $0.0876 would break the run of higher lows.
Pi Coin Price Prediction for This Week
This week, Pi Network is projected to reach $0.0917, inside a $0.0868 to $0.0950 band. Reaching this objective requires a daily close above the 50-day EMA at $0.09172, which capped recent advances. Clearing $0.09172 opens the descending 100-day EMA at $0.10087, while failing to break it leaves price bound beneath resistance for a fourth consecutive week.
Pi Network Price Prediction for October 2026
Based on the descending 100-day EMA trend currently 10.81% overhead, Pi is expected to reach between $0.0800 and $0.1150 range in October. This target depends on whether the 50-day EMA is reclaimed. The $0.0800 July base serves as the structural floor that protects the multi-month recovery.
Pi Coin Price Prediction for November 2026
By end-November, PI may reach $0.1150, with support at $0.1009 and resistance at $0.1300. This trajectory assumes October successfully secures and defends the 100-day EMA, turning it into dynamic support for the first time since June. The descending 200-day EMA at $0.13375 acts as the overhead cap for November and aligns with the year-end target.
Pi Network Price Prediction 2026 (Medium Term)
| Month | Price Target | Support | Resistance | ROI |
|---|---|---|---|---|
| Oct 2026 | $0.1009 | $0.0800 | $0.1150 | +12.15% |
| Nov 2026 | $0.1150 | $0.1009 | $0.1300 | +27.82% |
| Dec 2026 | $0.1338 | $0.1300 | $0.1600 | +48.72% |
Pi Network’s 2026 price range is projected at $0.0800–$0.1338 based on the latest EMA structure. Price is sitting exactly on the 20-day EMA at $0.08999 and the gap to the 50-day at $0.09172 has narrowed to 1.92% from 2.04%, so the bearish crossover continues to close. The 200-day EMA at $0.13375 remains the major hurdle and still doubles as the December target. Momentum has held its improvement rather than extended it, with the RSI above its signal line for a second week while price consolidates.
Want to diversify beyond Pi Network? Check out the Top 10 Cryptos To Invest In 2026 or our Ethereum Price Prediction
Pi Network Price Prediction in INR (2026–2030)
For Indian traders, here is what the PI price targets translate to in rupees.
| Period | PI Target USD | PI Price INR est. |
|---|---|---|
| October 2026 | $0.1009 | ₹9.63 |
| December 2026 | $0.1338 | ₹12.76 |
| 2027 | $0.18 | ₹17.17 |
| 2030 | $0.52 | ₹49.61 |
INR estimates use a USD/INR rate of approximately ₹95.40. Actual rupee values will move with the exchange rate.
Pi Network Long-Term Price Outlook (2027–2040)
The long-term outlook for PI rests on three structural drivers: the build-out of a usable app and DeFi ecosystem on the mainnet following the Protocol 27 upgrade, the pace at which locked and unmigrated supply is released into circulation, and whether the token secures broader regulated exchange access beyond its current listings.
The following forecasts are derived from network-adoption models, supply-release schedules, and historical PI volatility patterns. They represent scenario ranges, not price targets.
| Year | Price Target | Support | Resistance | ROI |
|---|---|---|---|---|
| 2027 | $0.18 | $0.09 | $0.32 | +100.07% |
| 2028 | $0.28 | $0.14 | $0.48 | +211.21% |
| 2029 | $0.40 | $0.20 | $0.66 | +344.59% |
| 2030 | $0.52 | $0.28 | $0.90 | +477.97% |
| 2031 | $0.60 | $0.32 | $1.05 | +566.89% |
| 2035 | $1.20 | $0.65 | $2.00 | +1233.78% |
| 2040 | $2.00 | $1.10 | $3.50 | +2122.96% |
Where Will Pi Network Price Go in 2030?
Pi Network could trade near $0.52 in 2030, within a range of $0.28 to $0.90, assuming the migration overhang subsides and circulating float stabilizes. Long-term valuation models anticipate organic application usage, peer-to-peer commerce, and native DEX utility serving as the primary drivers of sustained demand.
Where Will Pi Network Price Go in 2031?
The 2031 outlook points to $0.60 for PI, with a range of $0.32–$1.05, on the assumption that growth by then depends on real transaction volume rather than community expansion. Cycle analysis models 2031 as a consolidation and base-building phase following the wider post-2028 crypto expansion. Growth during this stage will rely on verified on-chain transaction throughput rather than initial community onboarding.
Where Will Pi Network Price Go in 2040?
By 2040, Pi Network’s price is estimated at $2.00, ranging from $1.10 to $3.50, assuming the network sustains genuine utility over a fourteen-year horizon. Adoption-curve models suggest $1.50–$3.00 under moderate growth, while aggressive scenarios would exceed $5.00. These forecasts carry very high uncertainty and should be read as scenario ranges, not fixed targets.
Pi Network Technical Analysis
The following technical indicators were used to derive the Pi Network price prediction above.
| Indicator | Value | Signal |
|---|---|---|
| Relative Strength Index (14-Day RSI) | 49.48 | Neutral, just under the midline |
| RSI Moving Average | 44.91 | Bullish crossover, RSI 4.6 above |
| 20-Day EMA | $0.08999 | Pivot, price sitting on it |
| 50-Day EMA | $0.09172 | Resistance, 1.91% above price |
| 100-Day EMA | $0.10087 | Medium-term resistance |
| 200-Day EMA | $0.13375 | Long-term resistance, still falling |
| Trading Volume | 17.95M PI | Partial session, up from 13.94M |
Relative Strength Index (RSI)
The 14-day RSI stands at 49.48, holding 4.57 points above its signal moving average at 44.91. The positive momentum spread has held across two weeks, confirming that momentum is stabilizing. While the indicator has dipped fractionally beneath the 50 neutral mark, this indicates consolidation rather than active selling pressure. A confirmed daily close above 50 would confirm renewed upward momentum.
Exponential Moving Averages – 20-Day, 50-Day, 100-Day and 200-Day EMA
PI is trading 0.02% below its 20-day EMA at $0.08999, effectively sitting on it, and 1.91% below the 50-day EMA at $0.09172. The session high of $0.09150 fell 0.24% short of the 50-day, so unlike last week price did not reach that average at all, which is a step back even on a higher close. The 20-day sits 1.92% under the 50-day, narrower than the 2.04% of last week, so the bearish crossover keeps closing and is on track to resolve within weeks at the current rate. The 100-day EMA at $0.10087 and the 200-day EMA at $0.13375 are still falling, with the gap to the 100-day line at 10.81%.
Volume Analysis
Daily turnover has reached 17.95 million PI with several hours remaining in the trading session, exceeding the 13.94 million PI recorded at a similar point last week. This breaks the prior pattern of diminishing volume across recovery attempts, showing expanding trader participation on green candles. Maintaining volume expansion during tests of the 50-day EMA at $0.09172 will be required to confirm a closing breakout.
What Is the Pi Network Price Prediction for Indian Traders?
PI is not listed on CoinDCX, so Indian traders are tracking it on overseas venues priced in USD. At roughly ₹8.58 against the 2030 base case of ₹49.61, the long-term scenario implies a 5.8x move, though that rests on adoption assumptions rather than the technical picture above.
Disclaimer
This article is for informational purposes only and does not constitute financial or investment advice. Digital asset markets are highly volatile and prices can change rapidly. Past performance is not indicative of future results. The price predictions above are based on technical and on-chain analysis and should not be construed as investment recommendations. Always conduct your own research before making any trading or investment decisions.
FAQs
Q1. What will Pi Network be worth in 2026?
Pi Network is projected to trade within a channel of $0.0800 to $0.1338 through the remainder of 2026, with a year-end target of $0.1338. The lower boundary tracks the July accumulation base, while the upper boundary aligns with the descending 200-day EMA. Defending the 20-day EMA near $0.0900 is the initial requirement to access higher price targets.
Q2. What will be the price of 1 PI in 2030?
The price of 1 PI may trade near $0.28–$0.90 in 2030, with a base case of $0.52, depending on adoption and market conditions. That range assumes most locked supply has entered circulation by then, so demand rather than unlock pressure would set the price.
Q3. Is Pi Network a safe investment in 2026?
Pi Network trades on multiple international spot platforms and is balancing on its 20-day moving average, but it remains an asset carrying high technical volatility well below its historical peaks. Because substantial quantities of migrating tokens continue to enter the circulating float, investors should manage exposure with disciplined position sizing.
Q4. What was Pi Network’s highest price?
Pi Network recorded an all-time high of approximately $2.98 on February 26, 2025, shortly after early open mainnet trading commenced. Thin initial order book depth and heavy launch demand drove that spike, after which price entered a multi-month consolidation phase.
Q5. What is the Pi Network price in India?
1 PI is worth roughly ₹8.58, based on current price levels and a USD/INR rate of about ₹95.40. PI is not listed on CoinDCX, so Indian traders track it on overseas venues priced in USD. The rupee figure will shift with both the token and the exchange rate.
Q6. What will be the Pi Network price in 2027?
By 2027, if Pi Network achieves stronger adoption and exchange listings, the price could range between $0.09 and $0.32, with a base case of $0.18, depending on market conditions and ecosystem growth. That base case implies roughly a 100% gain from current levels.
Q7. What is the Pi Coin price prediction for 2040?
Long-term price prediction models place PI between $1.10 and $3.50 by 2040, with a base case of $2.00. These are high-uncertainty scenario ranges over a fourteen-year horizon and depend heavily on Pi Network sustaining genuine network utility.
Q8. Does Pi Network have a future?
Yes, Pi Network’s future looks promising, as it is heavily focused on technical upgrades to solidify its infrastructure, with the clear goal of enabling a DeFi and smart contract ecosystem centered around a native DEX. Its success, however, depends on active participation, exchange listings, and real-world adoption.
Q9. How to sell Pi coins?
PI can be traded on international platforms that support spot pairs once user balances are fully migrated from the mining application to the mainnet wallet and KYC verification is finalized. Unmigrated balances cannot be transferred or traded externally.
Q10. Is Pi listed on CoinDCX?
No, Pi Network is not currently listed on CoinDCX, meaning it cannot be purchased or traded on the platform at present. CoinDCX is an FIU-IND registered Reporting Entity; users should monitor official platform announcements for any future listing updates.