


This FTX Token price prediction analyzes FTT’s short-term and long-term potential using technical indicators such as RSI, moving averages, recent price action, and key support and resistance levels. Discover the FTT price forecast for today, this week, June 2026, and long-term projections through 2040 based on the latest FTT price chart, market momentum, and the broader sentiment around distressed crypto assets.
FTX Token, also known as FTT coin, is currently trading near $0.3346, showing a strong short-term rebound after a sharp decline earlier this month. The 14-day RSI has recovered to 60.52, suggesting improving buying momentum, while the price has moved above the 20-day, 50-day, and 100-day EMAs. However, FTT is still trading below the 200-day EMA near $0.4250, which remains the most important resistance level for any sustainable trend reversal.
Based on the current chart structure, the FTT price outlook has turned short-term bullish, but the broader trend remains cautious. A breakout above $0.35-$0.36 could open the door for a retest of $0.40-$0.425, while failure to hold above $0.325 may pull the price back toward $0.30.
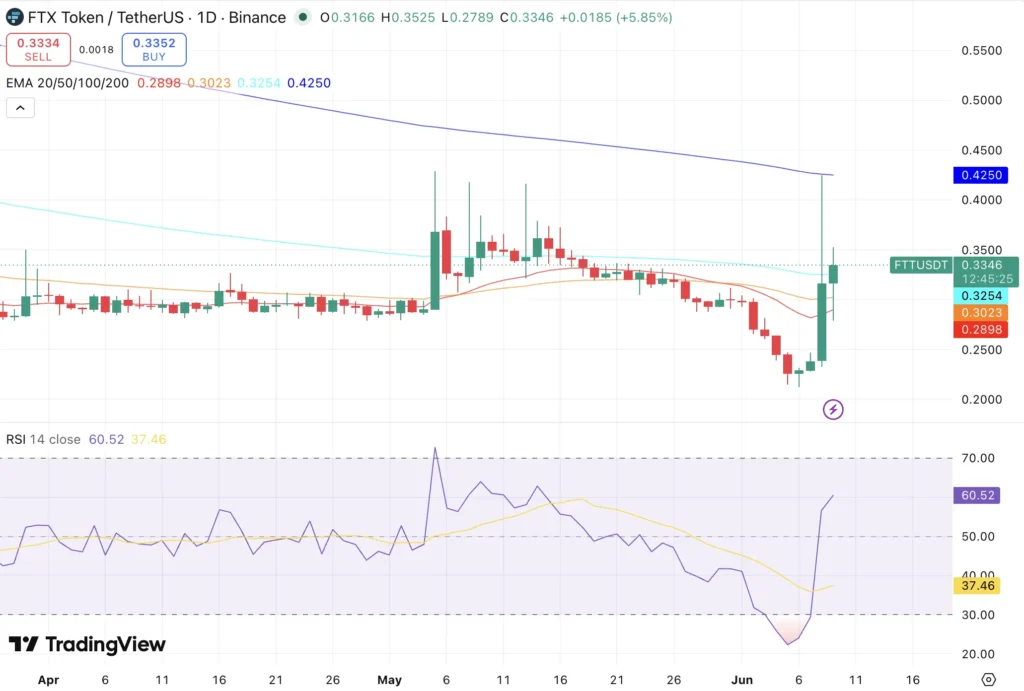
FTT/USDT, Source: TradingView
Key Insights
● Short-Term: FTT has reclaimed the 20-day, 50-day, and 100-day EMAs, signaling a sharp improvement in near-term momentum.
● Medium-Term 2026: The 200-day EMA near $0.4250 remains the key bull/bear line. A breakout above this level could push FTT toward $0.45-$0.50, while rejection may keep the token range-bound.
● Long-Term 2030: FTT’s long-term price forecast remains highly speculative because the token’s original utility was tied to the collapsed FTX exchange. Any long-term upside will depend more on market speculation, legal developments, estate-related updates, and broader crypto sentiment than organic ecosystem growth.
FTT Short-Term Price Prediction – Today, This Week, June 2026
Here is the FTT price prediction for today, this week, and June 2026.
| Timeframe | Price Target | Support | Resistance | ROI |
|---|---|---|---|---|
| Next 24 Hrs | $0.35 | $0.325 | $0.35 | +4.60% |
| This Week | $0.38 | $0.30 | $0.38 | +13.57% |
| June 2026 | $0.425 | $0.29 | $0.425 | +27.02% |
| July 2026 | $0.45 | $0.32 | $0.45 | +34.49% |
FTT Price Prediction Today
FTT is currently trading near $0.3346 and is expected to move between $0.325 and $0.35 over the next 24 hours. The token has bounced strongly from the $0.22-$0.24 zone and is now trading above the 20-day EMA at $0.2898, 50-day EMA at $0.3023, and 100-day EMA at $0.3254.
This shows that buyers have regained short-term control. If FTT holds above $0.325, the next immediate FTT price target is $0.35. A clean move above this level could extend the rally toward $0.36-$0.38. However, if the price falls below $0.325, the short-term setup may weaken, with $0.30 acting as the next key support.
FTT Price Prediction for This Week
The FTT price forecast for this week points to a possible trading range between $0.30 and $0.38. The daily RSI at 60.52 indicates that momentum has improved, but the token is not yet in overbought territory. This gives FTT some room to move higher if buying pressure continues.
The most important level to watch this week is $0.35-$0.36. A breakout above this zone could trigger a move toward $0.38, especially if trading volume remains strong. On the downside, a drop below $0.325 would signal fading momentum, while a deeper correction below $0.30 could bring sellers back into control.
FTT Price Prediction for June 2026
FTT’s June 2026 price prediction targets $0.425, with a possible range of $0.29-$0.425. The 200-day EMA near $0.4250 is the biggest resistance on the current chart. Until FTT breaks and sustains above this level, the broader recovery remains incomplete.
A monthly close above $0.425 would be a major technical signal, as it would show that FTT has reclaimed its long-term moving average after weeks of weakness. In that case, the next FTT price target could shift toward $0.45-$0.50. However, if FTT fails to clear the 200-day EMA, the token may continue consolidating between $0.30 and $0.40.
Trade FTT in INR on ![]()
Deposit and withdraw in INR (₹).
No Conversion to Crypto Required.

FTT Price Prediction for July 2026
FTT’s July 2026 price prediction targets $0.45, with a projected range of $0.32-$0.45. If the token sustains above the 100-day EMA and attempts another breakout above the 200-day EMA, buyers may push the price toward the $0.45 region.
However, traders should avoid reading the recent rebound as a confirmed long-term reversal too early. FTT remains a highly speculative token, and its price action can react sharply to news around FTX, bankruptcy proceedings, estate repayments, exchange listings, or broader risk-on sentiment in the crypto market.
FTT Price Prediction 2026: Medium-Term Outlook
| Month | Price Target | Support | Resistance | ROI |
|---|---|---|---|---|
| June 2026 | $0.425 | $0.29 | $0.425 | +27.02% |
| July 2026 | $0.45 | $0.32 | $0.45 | +34.49% |
| August 2026 | $0.48 | $0.34 | $0.48 | +43.45% |
| September 2026 | $0.50 | $0.36 | $0.50 | +49.43% |
| October 2026 | $0.46 | $0.32 | $0.50 | +37.48% |
| November 2026 | $0.52 | $0.35 | $0.52 | +55.41% |
| December 2026 | $0.55 | $0.38 | $0.55 | +64.38% |
FTT’s 2026 price range is projected between $0.29 and $0.55, based on the current technical rebound and the token’s historically volatile price behavior. The chart shows a strong recovery from recent lows, but the token still needs to break above the 200-day EMA near $0.425 to confirm a stronger medium-term trend.
The bullish FTT price target for 2026 sits near $0.55, but this would require sustained buying momentum, a broader crypto market recovery, and positive sentiment around the FTX estate or any token-related speculation. On the bearish side, a loss of $0.30 could drag FTT back toward $0.25-$0.22, especially if the current rebound fails to attract follow-through volume.
FTT Price Prediction in INR 2026–2030
For Indian traders, here’s what the FTT coin price targets translate to in rupees.
| Period | FTT Target USD | FTT Price INR Est. |
|---|---|---|
| June 2026 | $0.425 | ₹35.70 |
| December 2026 | $0.55 | ₹46.20 |
| 2027 | $0.60 | ₹50.40 |
| 2028 | $0.70 | ₹58.80 |
| 2029 | $0.80 | ₹67.20 |
| 2030 | $0.90 | ₹75.60 |
INR estimates are based on an assumed USD/INR rate of around ₹84. Actual prices will vary depending on exchange rates, liquidity, spreads, and market conditions at the time of trading.
FTT Long-Term Price Outlook 2027–2040
The long-term FTT price outlook is highly speculative. Unlike Ethereum, Solana, or Bitcoin, FTT does not currently have the same level of network utility, developer activity, or institutional adoption. Its price movements are more likely to be driven by market cycles, FTX-related headlines, legal updates, exchange availability, and speculative trading.
The following FTT price forecast should be read as scenario-based projections, not guaranteed targets.
| Year | Price Target | Support | Resistance | ROI |
|---|---|---|---|---|
| 2027 | $0.60 | $0.35 | $0.75 | +79.32% |
| 2028 | $0.70 | $0.40 | $0.90 | +109.20% |
| 2029 | $0.80 | $0.45 | $1.00 | +139.09% |
| 2030 | $0.90 | $0.50 | $1.20 | +168.98% |
| 2031 | $0.75 | $0.45 | $1.10 | +124.15% |
| 2035 | $1.20 | $0.60 | $1.80 | +258.64% |
| 2040 | $1.80 | $0.80 | $2.50 | +437.96% |
Where Will FTT Price Go in 2030?
The FTT price prediction for 2030 targets $0.90, with a possible range of $0.50-$1.20. This forecast assumes that FTT continues to trade as a speculative legacy token and benefits from broader crypto market cycles.
However, the 2030 FTT price target carries high uncertainty. For FTT to move above $1, the market would likely need a combination of strong risk appetite, renewed attention around FTX-linked assets, improved liquidity, and broader altcoin market strength. Without these catalysts, FTT may remain range-bound below the $1 level.
Where Will FTT Price Go in 2031?
The FTT price forecast for 2031 targets $0.75, with a range of $0.45-$1.10. If 2030 becomes a strong cycle year for crypto, 2031 could see cooling momentum and profit-taking, similar to previous post-rally phases in the crypto market.
For traders, the key signals to monitor would be trading volume, exchange liquidity, price reaction near $1, and whether FTT continues to attract speculative demand or fades after short-term rallies.
Where Will FTT Price Go in 2040?
By 2040, FTT’s price is projected at $1.80, with a broad possible range between $0.80 and $2.50. This is not a utility-driven forecast but a long-term speculative scenario. If FTT survives multiple market cycles and remains listed on major exchanges, it could continue to trade as a high-risk legacy token.
That said, compared to fundamentally stronger crypto assets, FTT’s long-term investment case remains weak. The token may see sharp rallies, but sustained appreciation would require a much clearer value driver than the current market structure provides.
FTT Technical Analysis
The following technical indicators were used to derive the FTT price prediction above. These values should be updated at the time of publishing.
| Indicator | Value | Signal |
|---|---|---|
| Current FTT Price | $0.3346 | Short-term bullish |
| 14-Day RSI | 60.52 | Bullish-neutral |
| 20-Day EMA | $0.2898 | Bullish |
| 50-Day EMA | $0.3023 | Bullish |
| 100-Day EMA | $0.3254 | Bullish |
| 200-Day EMA | $0.4250 | Bearish until reclaimed |
Relative Strength Index RSI
The 14-day RSI is at 60.52, showing that FTT has moved back into bullish-neutral territory. The RSI is above the midline but still below the overbought zone of 70, which means the token has room for further upside if buying momentum continues.
However, traders should watch for a quick RSI spike above 70. Since FTT is a volatile token, sudden price rallies can quickly become overheated, increasing the risk of a pullback.
Moving Averages
FTT is currently trading above its 20-day EMA at $0.2898, 50-day EMA at $0.3023, and 100-day EMA at $0.3254. This is a positive short-term signal because the token has reclaimed multiple moving averages after a sharp rebound.
The 200-day EMA at $0.4250 remains the most important resistance. A daily close above this level would strengthen the FTT price outlook and could shift the medium-term structure from recovery mode to a stronger bullish setup.
Volume Analysis
The latest price action shows a strong green candle after a steep decline, indicating renewed buying interest. A large rebound candle often signals short-covering, speculative buying, or a reaction to fresh market news.
For the rally to continue, FTT needs follow-through volume above $0.35-$0.36. If volume fades near resistance, the token may enter another consolidation phase between $0.30 and $0.35.
FAQs
1. What is the FTT price prediction for 2026?
The FTT price prediction for 2026 targets $0.55, with a possible range between $0.29 and $0.55, depending on whether the token can break above the 200-day EMA near $0.425.
2. Can FTT reach $1?
FTT can reach $1 only if it sees strong speculative demand, improved liquidity, and a broader altcoin market rally. However, the token remains high-risk because its original utility was linked to the collapsed FTX exchange.
3. Is FTT coin bullish or bearish right now?
FTT is short-term bullish on the daily chart because it is trading above the 20-day, 50-day, and 100-day EMAs. However, the broader trend remains cautious until the token breaks above the 200-day EMA near $0.425.
4. What is the FTT price prediction for 2030?
The FTT price prediction for 2030 targets $0.90, with a possible range of $0.50-$1.20. This is a speculative forecast and depends on broader crypto market conditions, liquidity, and FTX-related sentiment.
5. Is FTT a good investment?
FTT is a high-risk crypto asset. It may offer short-term trading opportunities due to volatility, but long-term investors should be cautious because the token lacks strong current utility after the collapse of FTX.
Disclaimer: Crypto assets are highly volatile, and price predictions are based on technical indicators, market trends, and available chart data at the time of writing. This FTT price prediction is for informational and educational purposes only and should not be considered financial advice. Always do your own research before investing or trading.

