


Zcash continues to lead the privacy-focused digital asset sector, driven by zero-knowledge cryptographic verification and a fixed 21-million programmatic supply schedule. This technical analysis evaluates short-term, medium-term, and multi-year ZEC trends across daily, weekly, 2026, 2030, and 2040 horizons. Using quantitative indicators, including the Relative Strength Index (RSI), Exponential Moving Averages (EMAs), and volume profiles, this forecast outlines operational support floors, overhead resistance barriers, and long-term expansion targets based on prevailing market structure.
Zcash (ZEC) is trading near $1,044, down 10.23% in the latest session across an intraday channel between $992.88 and $1,198.71, its first trade below $1,000 since early September. The slide extends a four-session sell-off that began after last week’s NU7 activation rally and has now broken both the $1,117 to $1,121 floor, which had held on three separate tests, and the 100-day EMA.
Key Insights
- Short-Term Outlook: ZEC fell 10.23% to $1,044 within an intraday channel of $992.88 to $1,198.71, breaking below the $1,117 to $1,121 floor and the 100-day EMA. Reclaiming $1,084 on daily closes would ease the pressure and open a retest of the broken floor near $1,120, while a slip beneath $1,000 exposes the $950 area.
- 2026 & 2030 Outlook: The 20-day EMA at $1,220.05 and the 50-day EMA at $1,208.88 are now about $11 apart and set to cross lower within days if price stays near current levels, while the latest session has pushed price beneath the 100-day EMA for the first time since the August breakout. The macro trend still holds 20% above the ascending 200-day EMA at $870.66, which keeps the higher-timeframe baseline protected even as the short-term structure weakens.
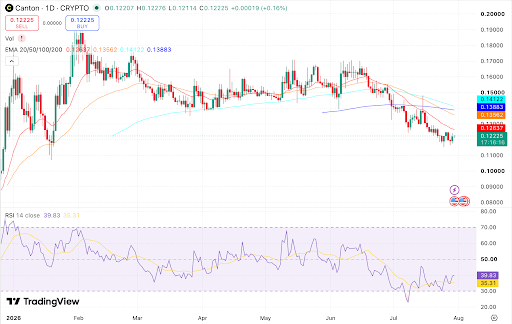
- Technical Analysis: The 14-day RSI at 37.58 has broken below the low-40s floor that held through October and sits 11.53 points beneath its signal line at 49.11. Spot price trades 14.5% beneath the 20-day EMA at $1,220.05 and 3.7% beneath the 100-day EMA at $1,083.64, while holding 20% above the 200-day EMA at $870.66.
Zcash Short-Term Price Prediction – Today, This Week, November 2026
Here is the Zcash coin price prediction for today, this week, and November 2026.
| Period | Price Target | Support | Resistance | ROI |
|---|---|---|---|---|
| Next 24 Hrs | $1,070 | $1,000 | $1,090 | +2.5% |
| This Week | $1,090 | $950 | $1,160 | +4.4% |
| November 2026 | $1,120 | $930 | $1,250 | +7.3% |
ZEC Price Prediction Today
ZEC’s price prediction for today is $1,070, with the daily range set between $1,000 and $1,090. Zcash is trading near $1,044, sitting 3.7% beneath the 100-day EMA at $1,083.64 after buyers pulled price back from the intraday low at $992.88. Holding above $1,000 is required to reach $1,070, whereas a close beneath it leaves the $950 area exposed.
ZEC Price Forecast for This Week
The weekly ZEC price forecast targets $1,090, with prices expected to trade between $950 and $1,160. The sell-off since last week’s NU7 activation rally has carried price through the $1,117 to $1,121 floor and the 100-day EMA, so both levels now act as resistance, with the 100-day EMA at $1,083.64 the first hurdle for any rebound.
Heavy volume on the break points to forced selling by leveraged traders, which often leaves room for a relief bounce, but a recovery would need daily closes back above $1,121 to show the breakdown has failed. While the RSI approaches oversold territory, a weekly close beneath $950 would extend the decline toward the 200-day EMA at $870.66 as the next structural support floor.
ZEC Price Prediction for November 2026
ZEC’s November 2026 price outlook points to $1,120, within an expected channel of $930 to $1,250. Reaching this objective requires reclaiming the 100-day EMA at $1,083.64 on daily closes and then retesting the broken $1,117 to $1,121 floor from below, which is now the key level separating a relief rally from a deeper correction.
On the network side, the Network Upgrade 7 (NU7) went live on mainnet at block 3,543,405 last week, cutting block times to 25 seconds while retaining the programmatic proof-of-work halving schedule following a 98.9% coinholder consensus vote, but the activation-day rally faded quickly, so the upgrade’s effect on network usage now matters more than the event itself. Below spot price, immediate support rests at the $1,000 level, followed by the $950 area, with the 200-day EMA at $870.66 serving as the broader trend invalidation marker.
ZEC Price Prediction for December 2026
ZEC is projected to reach $1,220 in December 2026, within an expected range of $950 to $1,400. With NU7 now live on mainnet, the year-end outlook depends on whether faster 25-second blocks and the new rule that sets aside part of transaction fees for future block rewards lift network usage and keep demand for regulated ZEC investment products steady.
On the chart, reaching the target requires a recovery back above the 20-day and 50-day EMAs near $1,210 to $1,220, while the 200-day EMA, now at $870.66, is the level that would need to hold on any further pullback.
ZEC Price Prediction 2026 to 2027 (Medium Term)
| Month | Price Target | Support | Resistance | ROI |
|---|---|---|---|---|
| Nov 2026 | $1,120 | $930 | $1,250 | +7.3% |
| Dec 2026 | $1,220 | $950 | $1,400 | +16.9% |
| Jan 2027 | $1,300 | $1,000 | $1,480 | +24.6% |
| Feb 2027 | $1,380 | $1,050 | $1,560 | +32.2% |
| Mar 2027 | $1,460 | $1,100 | $1,650 | +39.9% |
Zcash’s medium-term price channel through March 2027 is projected at $930 to $1,650, guided first by whether price can recover the 100-day EMA and the broken $1,117 to $1,121 floor after the post-NU7 sell-off. The 20-day EMA at $1,220.05 remains the level deciding the broader near-term direction: reclaiming it would restore the technical structure that propelled price from $858 to $1,680, whereas ongoing rejections will solidify it as resistance.
The January to March 2027 targets assume NU7 keeps running smoothly and that price recovers back above the $1,390 to $1,397 ceiling from late October by March, which would keep the 2027 target of $2,200 within reach later in the year.
Directly beneath spot price, the $1,000 level is initial support, while the $950 area and the 200-day EMA at $870.66 provide deeper structural shelves. With the 20-day and 50-day EMAs only about $11 apart, a bearish crossover is likely within days unless price recovers quickly, and the 14-day RSI at 37.58 needs to climb back above 50 to confirm that the breakdown has run its course.
Trade Crypto in INR on 
Deposit and withdraw in INR (₹).
No Conversion to Crypto Required.

Zcash Price in INR for Indian Traders
At the current spot price and an exchange rate of roughly ₹93.9 to the dollar, here is what the headline targets translate to in rupees.
| Level | Approx. INR |
|---|---|
| Current price ($1,044) | ₹98,000 |
| November 2026 target ($1,120) | ₹1,05,200 |
| December 2026 target ($1,220) | ₹1,14,600 |
| 2030 target ($3,700) | ₹3,47,400 |
INR figures move with the USD/INR rate as well as the ZEC price, so treat them as indicative.
Read also: How to buy Zcash (ZEC) in India
ZEC Crypto Price Prediction 2026 to 2040 (Long Term)
| Year | Price Target | Support | Resistance | ROI |
|---|---|---|---|---|
| 2027 | $2,200 | $1,100 | $2,600 | +110.8% |
| 2028 | $2,950 | $2,600 | $3,300 | +182.6% |
| 2029 | $3,300 | $2,950 | $3,650 | +216.2% |
| 2030 | $3,700 | $3,300 | $4,100 | +254.5% |
| 2031 | $4,000 | $3,600 | $4,400 | +283.2% |
| 2035 | $5,100 | $4,400 | $5,800 | +388.6% |
| 2040 | $6,550 | $5,500 | $7,600 | +527.5% |
Where Will Zcash Price Go in 2030?
Zcash’s 2030 target is $3,700, within an estimated corridor of $3,300 to $4,100, supported by the 2028 halving supply reduction, regulated spot ETF liquidity, and expanding institutional demand for confidential settlement. With over 19.7 million of the 21 million total ZEC mined by 2030, algorithmic scarcity serves as a central valuation driver. Stock-to-Flow and Power Law models support this range under sustained network adoption, representing scenario-based estimates rather than fixed price guarantees.
Where Will Zcash Price Go in 2031?
Zcash’s 2031 estimate is $4,000, with a range of $3,600 to $4,400, as the market enters the post-2028 halving digestion phase. Cycle analysis suggests 2031 will serve as a consolidation and base-building phase following the wider market expansion. The ZEC price outlook remains dependent on sustained crypto market conditions.
Where Will Zcash Price Go in 2040?
By 2040, Zcash is projected to reach an average target of $6,550, ranging from $5,500 to $7,600, at which point over 99% of the 21 million total supply will have been mined. Metcalfe’s Law and adoption-curve models align near this range under moderate adoption assumptions, while aggressive scenarios exceed $8,000. These multi-decade forecasts carry high uncertainty and reflect analytical scenario ranges rather than fixed targets.
Zcash Technical Analysis
The following technical indicators were used to derive the price predictions above.
| Indicator | Value | Signal |
|---|---|---|
| Relative Strength Index (14-Day RSI) | 37.58 | Bearish |
| 50-Day EMA | $1,208.88 | Bearish |
| 200-Day EMA | $870.66 | Bullish |
Relative Strength Index (RSI)
The 14-day RSI is at 37.58, its lowest reading since June, after breaking below the low-40s floor it held across five separate tests through October and early November. Readings above 70 indicate overbought conditions where price advanced faster than buyers could sustain, while readings below 30 mark oversold conditions; ZEC now sits in the lower part of the range without yet reaching that oversold threshold.
The oscillator sits 11.53 points beneath its signal line at 49.11, the widest bearish gap since the early-October sell-off, which confirms that momentum has turned against buyers. The 50 midline separates a standard correction inside an uptrend from a broader technical reversal, and the RSI would need to recover above it to suggest that the sell-off has run its course.
Exponential Moving Averages (50-Day & 200-Day EMA)
ZEC trades beneath its 20-day EMA at $1,220.05, its 50-day EMA at $1,208.88, and its 100-day EMA at $1,083.64, while holding above its 200-day EMA at $870.66, after the four-session sell-off erased the gains from last week’s NU7 activation rally.
The latest session pushed price beneath the 100-day EMA for the first time since the August breakout, removing the support layer that had underpinned every pullback since then. The 20-day and 50-day EMAs are now about $11 apart and turning lower, which puts a bearish crossover within days if price does not recover. The 200-day EMA at $870.66 is now the main structural buffer, and a sustained break beneath it would challenge the multi-month macro uptrend itself.
Volume Analysis
Zcash’s trading volume reflects roughly 152.12K ZEC with less than an hour remaining in the daily session, one of the heaviest sessions since early October and well above the 96.74K ZEC that accompanied the mid-October sweep to $1,047.67.
Heavy participation on a 10.23% decline that breaks the multi-week floor shows sellers in firm control of the move, with forced exits by leveraged traders adding to the pressure. However, the recovery from $992.88 to above $1,040 late in the session shows that buyers are defending the $1,000 level. A daily close back above the 100-day EMA at $1,084 on sustained volume would mark a shift in control, while a close beneath $1,000 would leave sellers firmly in charge.
Disclaimer: This article is for informational purposes only and does not constitute financial or investment advice. Crypto markets are highly volatile. Always do your own research (DYOR) before making any investment decisions.
FAQs
What is ZEC crypto?
Zcash (ZEC) is a privacy-focused crypto asset that uses zero-knowledge proofs (zk-SNARKs) to enable confidential transactions while maintaining blockchain transparency. It allows users to choose between transparent and shielded addresses, giving greater control over financial privacy.
Does ZEC have a future?
Yes. With privacy gaining renewed attention and a halving event scheduled for November 2025, ZEC’s long-term outlook appears constructive. Its strong fundamentals, limited 21 million supply, and growing institutional interest through products like Grayscale’s Zcash Trust suggest continued relevance in the next market cycle.
Is Zcash a good investment?
Zcash can be a good investment for traders seeking exposure to privacy-driven crypto narratives. However, it’s also a volatile asset prone to sharp price swings, also regulatory scrutiny can impact sentiment. Investors should weigh privacy-sector growth against risk and diversify accordingly.
How much is $1 in Zcash?
At current market levels, $1 equals roughly 0.0039 ZEC, based on a ZEC price of around $257. (Values fluctuate with live market rates, check the latest ZEC to USD conversion on trusted exchanges.)
What is Zcash mining?
Zcash uses a proof-of-work (PoW) mechanism based on the Equihash algorithm. Miners validate transactions and secure the network while earning new ZEC coins as block rewards. Following the 2025 halving, block rewards will be reduced, gradually tightening supply.
What does ZEC to USD mean?
ZEC to USD refers to the exchange rate between Zcash (ZEC) and the U.S. dollar. Traders use this pair to gauge ZEC’s market value, trade on exchanges, and track price performance against fiat currencies.
Is Zcash illegal?
No. Zcash is legal in most jurisdictions, including the U.S. However, because it enables private transactions, some exchanges impose compliance restrictions. Its privacy features are designed for user security, not illicit activity.
Will Zcash hit $10,000?
While technically possible, ZEC reaching $10,000 would require a dramatic surge in adoption, liquidity, and overall crypto market capitalisation. Analysts see such a level as highly speculative in the near term. Long-term projections remain more conservative, with targets around $500–$600 by 2030 under favorable conditions.