


Binance Coin (BNB) is trading near $598 while holding above its 200-day moving average, signaling resilience despite weak short-term momentum. The RSI remains neutral at 45.48, and MACD shows mild bearish pressure, suggesting Binance Coin price analysis covers short-term and long-term BNB trends with daily, weekly, 2026, 2030, and 2040 forecasts. This BNB Crypto price prediction explores potential price targets, support and resistance levels using technical indicators like RSI, MACD, moving averages, and momentum signals. Track BNB market direction, possible breakout zones, and future scenarios based on current chart patterns and technical structure.
Binance Coin (BNB) is currently trading at $592.60, reflecting a neutral market sentiment as of June 22, 2026. The 14-day RSI stands at 49.63, signaling neutral conditions, while the 50-day and 200-day moving averages are positioned at $592.15 and $590.17, respectively. The MACD is positive, indicating slightly bullish but weakening short-term momentum. Based on these technical indicators and broader market trends, BNB is expected to consolidate near $590–$595 while testing resistance around $594 before a possible breakout or pullback.
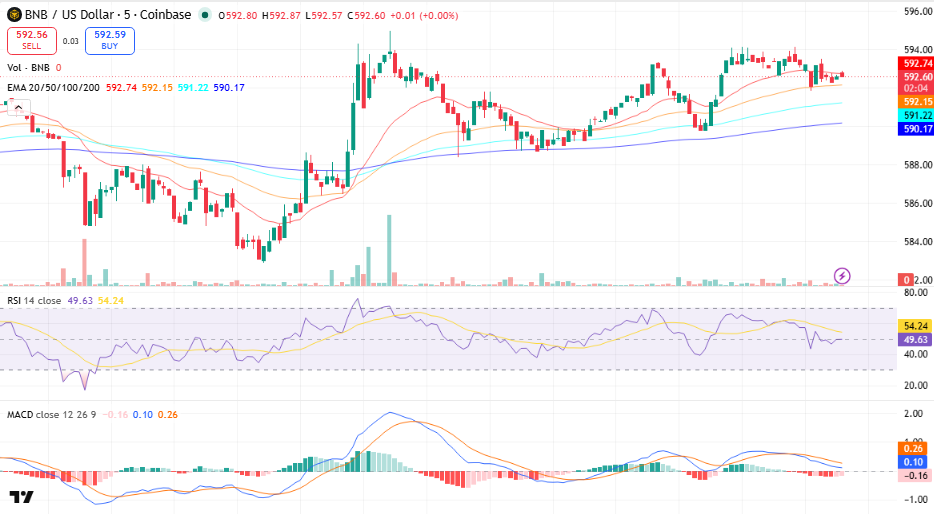
BNB/USDT, Source TradingView
Key Insights
● BNB may trade sideways this week between $590 and $595 as RSI remains near the neutral zone and price stays close to key EMAs.
● For June 2026, BNB is showing consolidation momentum with a possible upside test near $596 if buyers maintain support above $590.
● By 2026 and 2030, long-term movement will depend on market cycles, but the current technical setup shows BNB holding above major moving averages.
● Current technical analysis: Price is slightly above the 20/50/100/200 EMA structure, while MACD remains positive but momentum is cooling.
Binance Coin Short-Term Price Prediction – Today, This Week, June 2026
Here is the BNB Coin price prediction 2026 for today, this week, and June 2026.
| Timeframe | Price Target | Support | Resistance | ROI |
| Next 24 Hrs | $593 | $590 | $595 | +0.07% |
| This Week | $594 | $590 | $596 | +0.24% |
| June 2026 | $596 | $588 | $600 | +0.57% |
BNB Price Prediction Today
Binance Coin is trading at $592.60 and is expected to range between $590 and $595 in the next 24 hours. The RSI sits at 49.63 and the 20 EMA at $592.74 signals neutral short-term momentum. A hold above $590 support targets $595 upside, while a break below risks a drop toward $588.
Trade BNB in INR on ![]()
Deposit and withdraw in INR (₹).
No Conversion to Crypto Required.

Binance Coin Price Prediction for This Week
Binance Coin is projected to trade between $590 and $596 for the week of June 22–28, 2026. BNB is above the 50/100-day EMA levels near $592.15 and $591.22, with the MACD histogram contracting, pointing to weakening bullish momentum. A weekly close above $596 resistance opens the path toward $600, while a loss of $590 support targets $586.
BNB Price Prediction for June 2026
Binance Coin’s June 2026 price prediction targets $596, with a range of $588–$600. BNB is above its 200-day MA at $590.17, and the monthly RSI around 49.63 signals neutral conditions. A monthly close above $600 resistance would confirm stronger bullish momentum heading into the next phase.
Read Also: How to buy binance coin in India
BiBinance Coin Price Prediction for July 2026
Binance Coin’s July 2026 price prediction targets $600, with a range of $590–$605. BNB is above its 200-day MA at $590.17, and the monthly RSI around 50 signals neutral conditions. A monthly close above $605 resistance would confirm bullish momentum heading into Q3 2026.
BNB Price Prediction 2026 (Medium Term)
| Month | Price Target | Support | Resistance | ROI |
| June 2026 | $596 | $588 | $600 | +0.57% |
| July 2026 | $600 | $590 | $605 | +1.25% |
| Aug 2026 | $605 | $595 | $610 | +2.09% |
| Sep 2026 | $610 | $600 | $615 | +2.94% |
| Oct 2026 | $615 | $605 | $620 | +3.78% |
| Nov 2026 | $620 | $610 | $625 | +4.63% |
| Dec 2026 | $625 | $615 | $630 | +5.47% |
Binance Coin’s 2026 price range is projected at $588–$630, based on the current technical structure. The 200-day MA at $590.17 is the key bull/bear line — a hold above this level targets $600–$625, while a break below $590 support zone risks a drop toward $585. Weekly MACD is positive and RSI is trending around the midline, suggesting a neutral-to-bullish setup.
Binance Coin Price Prediction 2026 to 2040 (Long Term)
| Year | Price Target | Support | Resistance | ROI |
| 2027 | $650 | $600 | $700 | +9.68% |
| 2028 | $700 | $640 | $760 | +18.12% |
| 2029 | $780 | $700 | $850 | +31.66% |
| 2030 | $850 | $760 | $950 | +43.43% |
| 2031 | $920 | $820 | $1,000 | +55.24% |
| 2035 | $1,200 | $1,050 | $1,400 | +102.49% |
| 2040 | $1,500 | $1,300 | $1,800 | +153.21% |
Read also: How to buy Binance (BNB) coin in India
Binance Coin 2030 Forecast: What Is the Expected Price?
Binance Coin’s 2030 price prediction targets $850, within a range of $760–$950, supported by long-term adoption trends and possible market expansion. The current technical structure shows BNB holding above major moving averages, with the 200-day MA near $590.17 acting as a key long-term support level. The BNB price prediction 2030 outlook remains dependent on broader market cycles, network growth, and sustained buying pressure.
Binance Coin 2031 Outlook and Expected Price Range
The Binance Coin price prediction for 2031 targets $920, with a range of $820–$1,000, as the market enters a long-term growth phase. Cycle analysis suggests 2031 may reflect a continuation phase after previous market expansions, with support holding near major moving averages. The BNB price outlook will depend on momentum indicators, volume trends, and broader crypto market strength.
BNB Price Prediction 2040: Long-Term Forecast
By 2040, Binance Coin’s price is projected at $1,500, ranging from $1,300 to $1,800, under a long-term adoption scenario. Technical cycles, network activity, and demand growth could influence future valuation. The BNB price forecast carries uncertainty and should be viewed as a possible scenario range rather than a fixed target.
Binance Coin Technical Analysis
The following technical indicators were used to derive the price predictions above. Each indicator’s value and signal The following technical indicators were used to derive the price predictions above. Each indicator’s value and signal should be updated at the time of publishing.
| Indicator | Value | Signal |
| Relative Strength Index (14-Day RSI) | 49.63 | Neutral |
| 50-Day Moving Average | $592.15 | Bullish |
| 200-Day Moving Average | $590.17 | Bullish |
| MACD | 0.10 | Bullish |
| MACD Histogram | 0.26 | Positive |
| Average Trading Volume (14-Day) | Moderate | Decreasing |
Relative Strength Index (RSI)
The 14-day RSI is at 49.63, signaling neutral (30–70) conditions. RSI between 40 and 60 indicates market indecision, meaning the next major price movement may depend on a breakout above resistance or a breakdown below support.
Moving Averages (50-Day & 200-Day MA)
BNB is above its 50-day MA at $592.15 and above its 200-day MA at $590.17. Holding above both moving averages indicates a positive short-term structure, with $590.17 acting as a key support zone.
MACD (Moving Average Convergence Divergence)
The MACD is above the signal line with a histogram of 0.26, indicating bullish momentum. However, the momentum is slowing as the histogram contracts, suggesting consolidation before the next directional move.
Volume Analysis
Binance Coin’s recent trading volume shows moderate activity with declining momentum. Lower volume suggests weaker conviction, meaning BNB may continue consolidating near current levels until stronger buying or selling pressure appears.
Disclaimer: This article is for informational purposes only and does not constitute financial or investment advice. Crypto markets are highly volatile. Always do your own research (DYOR) before making any investment decisions.
FAQs
1. Can Binance Coin (BNB) Reach $10,000?
A $10,000 BNB price would require substantial growth in Binance ecosystem adoption, on-chain activity, and overall crypto market capitalization. While possible in a highly bullish long-term scenario, it would likely depend on sustained institutional adoption and broader market expansion.
2. How Much Will Binance Coin Be Worth in 2030?
BNB's value in 2030 will depend on market conditions, Binance ecosystem growth, regulatory developments, and crypto adoption. Many analysts remain optimistic about BNB's long-term outlook, though future prices remain speculative.
3. Can BNB Reach $5,000?
BNB reaching $5,000 would require significant upside from current levels and continued demand for Binance Smart Chain (BNB Chain) applications. A strong crypto bull market and growing utility could support higher valuations over time.
4. What Is the Binance Coin Price Prediction for Tomorrow?
Short-term BNB price movements depend on market sentiment, Bitcoin's trend, trading volume, and broader crypto market conditions. Traders often monitor support and resistance levels, RSI, and moving averages for daily price forecasts.
5. What Is the Binance Coin Price Prediction for 2027?
The BNB price prediction for 2027 remains largely bullish among market observers, supported by Binance ecosystem growth, DeFi adoption, and increasing use cases for BNB. However, actual performance will depend on market cycles and regulatory developments.
6. What Is the Binance Coin Price Prediction for 2030 in INR?
BNB's 2030 value in INR will depend on both the BNB/USD price and the USD-INR exchange rate. Investors should monitor long-term crypto adoption trends and currency fluctuations when evaluating future BNB valuations.
7. What Is the Binance Coin Price Prediction for 2040?
Long-term forecasts suggest BNB could benefit from continued blockchain adoption, decentralized finance growth, and expanding utility across the Binance ecosystem. However, 2040 price predictions should be viewed as highly speculative.
8. What Is the Binance Coin Price Prediction for 2050?
Predicting BNB's value in 2050 is challenging due to evolving technology, regulations, and market conditions. Long-term projections generally assume continued cryptocurrency adoption and ecosystem development.
9. Which Coin Will Pump Today on Binance?
No one can accurately predict which crypto asset will gain the most on a given day. Traders often track trending tokens, trading volume, news catalysts, and social sentiment to identify short-term opportunities.
10. How high will BNB go in 2026?
Analyst consensus and forecasting platforms project BNB to trade within a 2026 range of $580 to $1,570. The average forecasted price for the year sits between $800 and $1,100. Projections rely heavily on deflationary token burns, regulatory milestones, and institutional adoption via potential spot ETFs
11. What will be BNB price prediction 2026 in rupees?
The BNB price prediction for 2026 generally forecasts a trading range between ₹53,500 and ₹1,02,600 ($600 to $1,100). Market analysts project an average price of roughly ₹78,000 for the year, though exact figures depend heavily on overall crypto market momentum and USDT-INR exchange rates
12. What is BNB price prediction in 2026 per Wallet Investor?
Wallet Investor projects BNB to trade at an average price of around $585 by mid-2026. Their algorithmic forecast anticipates a short-term drop in the coming days, with a low target of roughly $578 and a high of $617.


