


Bitcoin (BTC) is trading near $64k, as on 15 July 2026. The current monthly candle is now down by around 18.39% for the month. BTC is trading below its 50-month EMA at $65,150, signaling bearish short-to-medium-term pressure. This Bitcoin price forecast covers the Bitcoin price today, tomorrow, the next 24 hours, the next seven days, July 2026 price outlook, and long-term Bitcoin price targets through 2040.
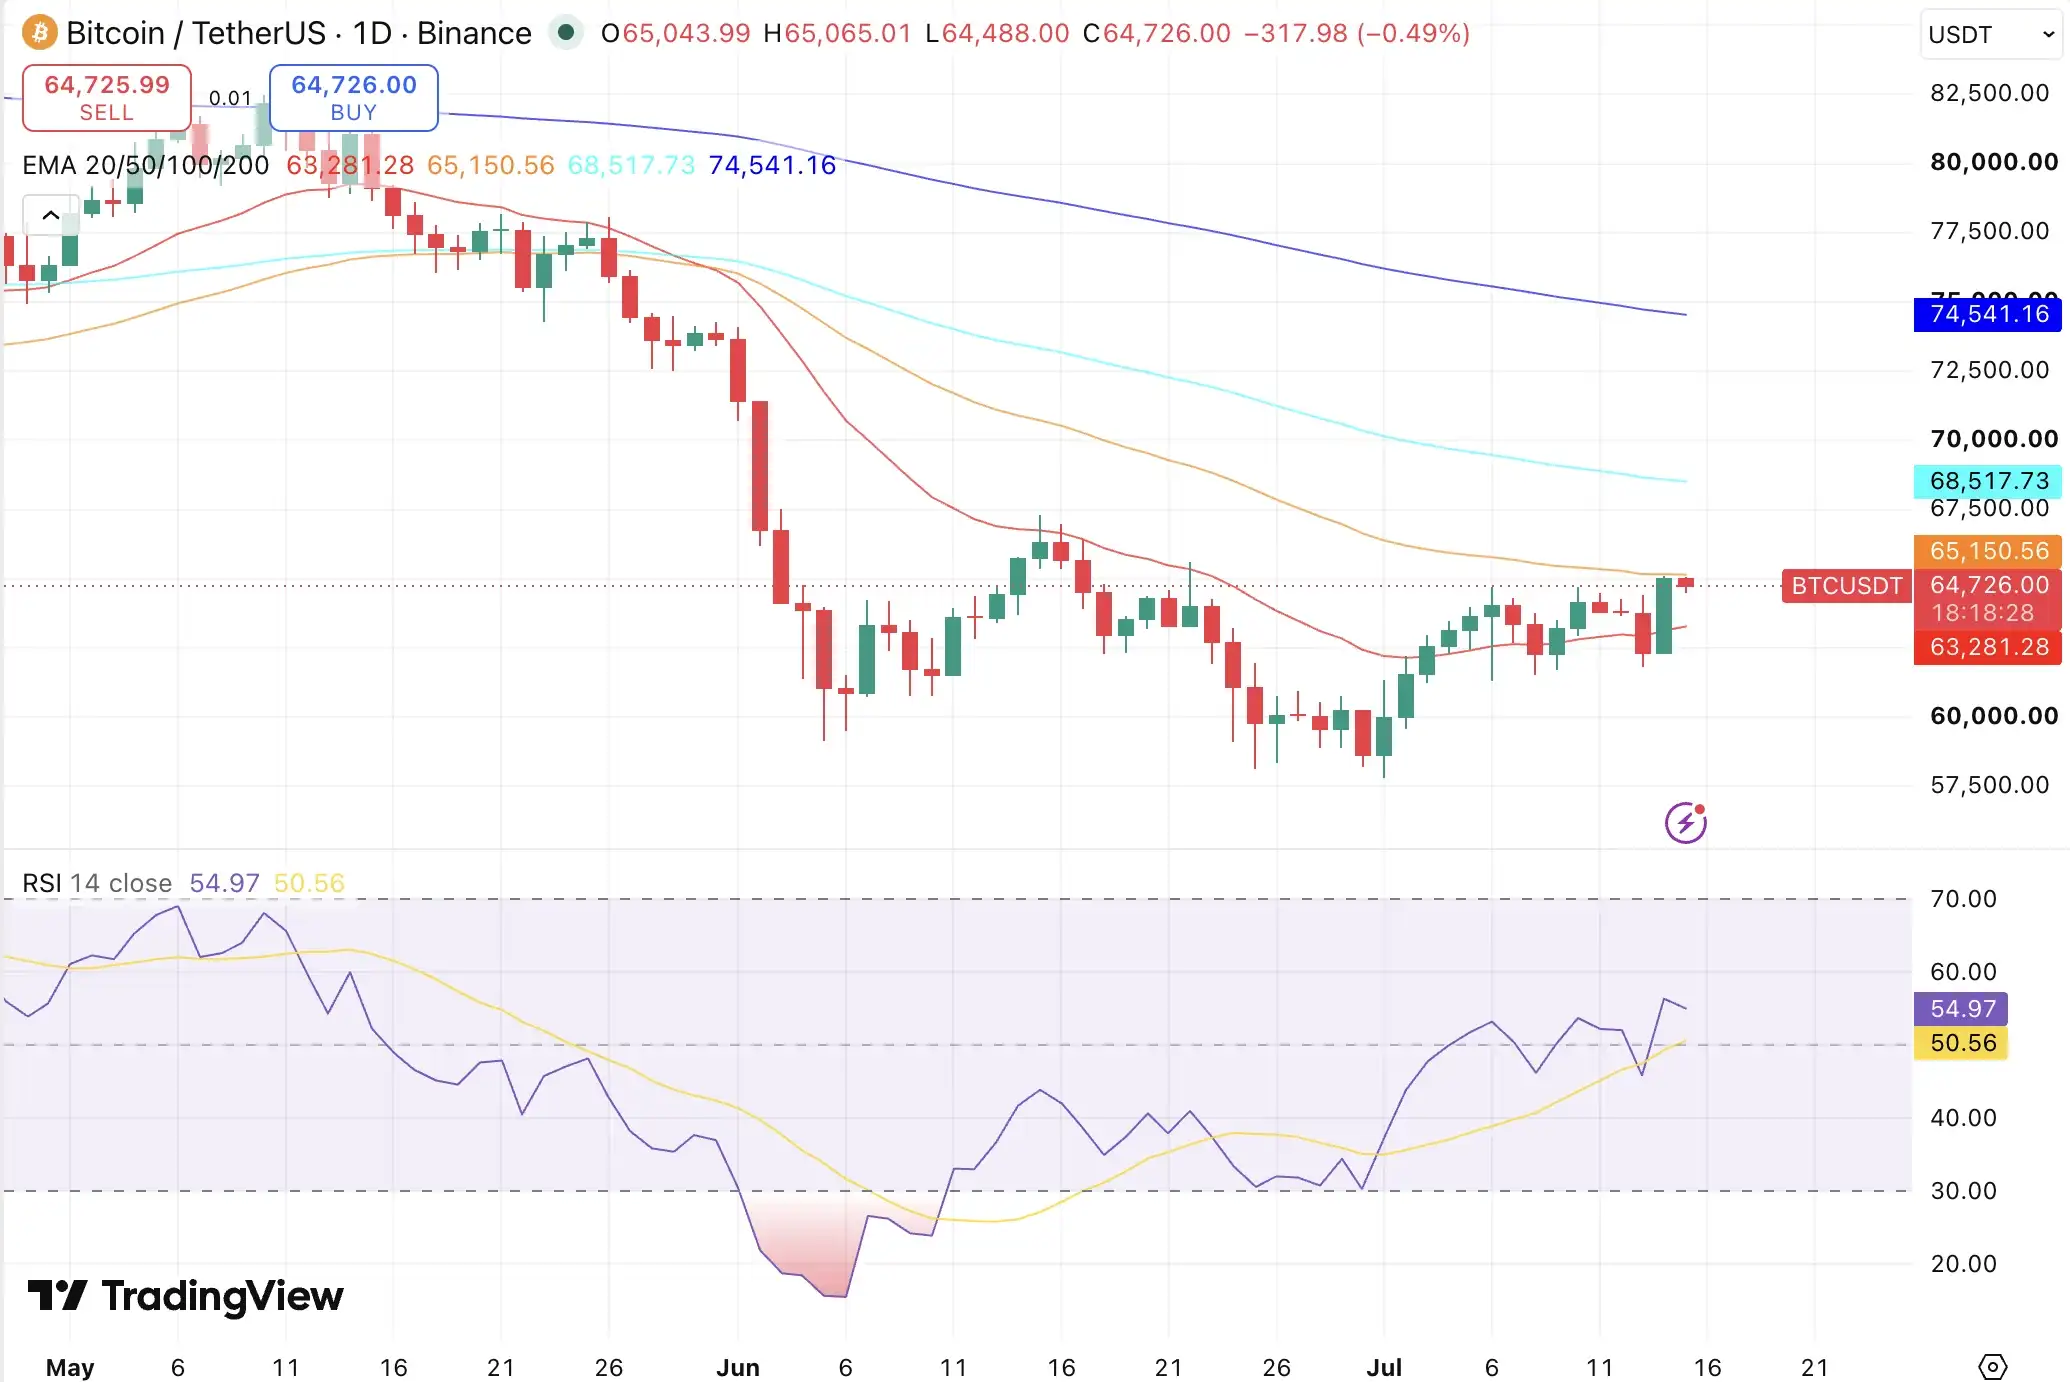
BTC/USDT, Source TradingView
Key Insights
- Bitcoin price today: BTC is trading near $64k down around 18.39% on the monthly candle.
- Short-term outlook: BTC is under pressure below the 50-month EMA at $65,631.31, with immediate support near $63,281.
- Next 24 hours: Bitcoin may target $68,200, assuming a decisive daily close above $65,600.
- This week: A move above $65,631 could push BTC price toward $72,700 in the next seven days.
- July 2026 outlook: BTC may attempt a recovery toward $70,000 assuming the token is decisively reclaim the $65,600 resistance level
Bitcoin Short-Term Price Prediction – Today, This Week, July 2026
Here is the Bitcoin price prediction 2026 for today, this week, and July 2026.
| Timeframe | Price Target | Support | Resistance | ROI |
| Next 24 Hrs | $60,500 | $58,115 | $61,800 | +0.62% |
| This Week | $62,000 | $58,115 | $62,500 | +1.45% |
| June 2026 | $62,500 | $58,115 | $65,631 | +3.95% |
| July 2026 | $65,600 | $55,000 | $70,000 | +9.10% |
Bitcoin Price Outlook Today
Bitcoin price today is trading near $60,128, after falling sharply from the monthly open of $73,674.39. The BTC price has already tested a monthly low of $58,115.01, which is now the most important short-term support level. For the next 24 hours, Bitcoin is likely to trade between $58,100 and $61,800. If BTC holds above $58,115, buyers may attempt a recovery toward $61,800 and $62,500. However, a breakdown below $58,115 could increase downside pressure and push Bitcoin toward the $55,000 support zone.
BTC Price Prediction for Tomorrow
Bitcoin price prediction for tomorrow remains cautious as BTC is still trading below the 50-month EMA at $65,631.31. If the price sustains above $60,000, BTC may attempt to move toward $61,000–$62,500. However, failure to hold the $58,115 support could trigger another bearish move.
The immediate Bitcoin price target for tomorrow is $61,000, with support at $58,115 and resistance near $62,500.
BTC Price Prediction for This Week
Bitcoin is projected to trade between $58,115 and $65,631 over the next seven days. The most important level for traders is the 50-month EMA at $65,631.31. A strong move above this level could open the door for a recovery toward $70,000. However, if BTC fails to reclaim $65,631, the price may remain under pressure. A weekly close below $58,115 would be bearish and could bring $55,000 into focus.
Trade BTC in INR on ![]()
Deposit and withdraw in INR (₹).
No Conversion to Crypto Required.

BTC Price Prediction for July 2026
Bitcoin’s July 2026 price prediction depends heavily on whether BTC can defend the $58,000 support zone. If Bitcoin holds above $58,115 and reclaims the 50-month EMA at $65,631.31, the July price outlook may improve toward $70,000. The base-case BTC price target for July 2026 is $65,600, while the bullish target stands near $70,000. On the downside, if selling pressure continues, Bitcoin may retest $55,000 before attempting a recovery.
Bitcoin Price Prediction 2026 (Medium Term)
| Month | Price Target | Support | Resistance | ROI |
| June 2026 | $66,000 | $65,200 | $66,250 | +0.30% |
| July 2026 | $66,250 | $65,200 | $66,250 | +0.68% |
| Aug 2026 | $66,250 | $65,200 | $66,250 | +0.68% |
| Sep 2026 | $66,000 | $65,200 | $66,250 | +0.30% |
| Oct 2026 | $66,250 | $65,200 | $66,250 | +0.68% |
| Nov 2026 | $66,250 | $65,200 | $66,250 | +0.68% |
| Dec 2026 | $66,000 | $65,200 | $66,250 | +0.30% |
Bitcoin’s 2026 price range is projected at $65,200–$66,250, driven by current price action above key moving averages. The 200-day MA at $65,192.09 is the key bull/bear line, a hold above targets $66,250, while a break below $65,200 risks a drop to $65,000. Weekly MACD is negative and RSI is trending slightly below the midline.
Bitcoin Price Prediction 2026 to 2040 (Long Term)
| Year | Price Target | Support | Resistance | ROI |
| 2027 | $66,250 | $65,200 | $66,250 | +0.68% |
| 2028 | $66,500 | $65,200 | $66,500 | +1.06% |
| 2029 | $66,750 | $65,500 | $66,750 | +1.44% |
| 2030 | $67,000 | $65,500 | $67,000 | +1.82% |
| 2031 | $67,250 | $65,500 | $67,250 | +2.20% |
| 2035 | $68,000 | $66,000 | $68,000 | +3.34% |
| 2040 | $70,000 | $67,000 | $70,000 | +6.38% |
Ready to tap on the BTC rally? read our guide on: How to buy Bitcoin
Bitcoin 2030 Forecast: What Is the Expected Price?
Bitcoin price prediction 2030 targets $67,000, within a range of $65,500–$67,000, fueled by the 2028 halving supply shock and growing institutional adoption. With over 19.7 million BTC mined by then, scarcity will be a key price driver. Stock-to-Flow and Power Law models support a range of $65,500–$67,000 under continued network growth.
Bitcoin 2031 Outlook and Expected Price Range
The Bitcoin price forecast for 2031 targets $67,250, with a range of $65,500–$67,250, as the market enters the post-2028 halving digestion phase. Cycle analysis suggests 2030 patterns may repeat, either consolidating from a prior peak or building a new base. LTH supply and exchange reserve trends will be the key on-chain signals to monitor.
BTC 2040 Long-Term Forecast
By 2040, Bitcoin price prediction 2040 projects a price target of $70,000, ranging from $67,000 to $70,000, as over 99% of the 21M supply will have been mined. Metcalfe’s Law and Power Law models point to $67,000–$70,000 under moderate adoption; aggressive scenarios exceed $70,000. These forecasts carry high uncertainty and should be read as scenario ranges, not fixed targets.
Bitcoin Technical Analysis
The BTC/USDT monthly chart shows that Bitcoin is currently in a corrective phase after failing to sustain above the $70,000 zone. The price is trading below both the 20-month and 50-month EMAs, indicating weakness in the short-to-medium-term trend. The following technical indicators were used to derive the price predictions above. Each indicator’s value and signal should be updated at the time of publishing.
| Indicator | Value | Signal |
| Relative Strength Index (14-Day RSI) | 49.74 | Neutral |
| 50-Day Moving Average | $65,631.31 | Bullish |
| 200-Day Moving Average | $65,192.09 | Bullish |
| MACD | -11.86 | Bearish |
| MACD Histogram | -11.86 | Negative |
| Average Trading Volume (14-Day) | $23.8B | Increasing |
Moving Average Analysis
Bitcoin is trading below the 20-month EMA at $79,979.08, which shows that the broader monthly momentum has weakened. BTC is also below the 50-month EMA at $65,631.31, making this the most important resistance level for the next recovery attempt.
However, the price remains above the 100-month EMA at $40,322.39, which means the long-term Bitcoin price structure has not fully broken down. As long as BTC stays above this long-term EMA, the broader Bitcoin price outlook remains corrective rather than structurally bearish.
Support and Resistance Levels
Bitcoin’s immediate support is placed near $58,115, which is the current monthly low. If this level breaks, BTC could decline toward $55,000 and then $50,000. On the upside, the first major resistance is near $65,631, followed by $70,000 and the monthly high of $74,092. A breakout above $74,092 would be required to shift the Bitcoin price forecast back into a stronger bullish zone.
Volume Analysis
Bitcoin’s monthly trading volume stands at 559.54K BTC, showing strong participation during the recent sell-off. Higher volume during a red monthly candle suggests that sellers remain active. For a bullish reversal, BTC needs to recover above $65,631 with strong buying volume.
On-Chain Metrics (Bonus Indicator)
80% of market participants are currently bullish according to CoinMarketCap’s community sentiment data. The Fear & Greed Index and realized price metrics are not available in the provided charts, while the current sentiment reading supports the constructive long-term technical setup.
Disclaimer: This article is for informational purposes only and does not constitute financial or investment advice. Crypto markets are highly volatile. Always do your own research (DYOR) before making any investment decisions.
FAQs
1. What will Bitcoin be worth in 2026?
Bitcoin's price in 2026 will depend on factors such as institutional adoption, ETF flows, macroeconomic conditions, and overall market sentiment. Analysts generally expect Bitcoin to remain highly volatile, with prices moving based on demand, liquidity, and broader financial market trends.
2. What is the Bitcoin price prediction for 2026 by month?
Monthly Bitcoin price predictions vary depending on market conditions. Short-term movements are often influenced by economic data, interest rate expectations, ETF inflows, and investor sentiment. Traders typically monitor key support and resistance levels to assess monthly price trends.
3. What is the realistic Bitcoin price prediction for 2030?
Many long-term forecasts suggest Bitcoin could trade significantly higher by 2030 if adoption continues to grow among institutions, corporations, and retail investors. However, actual prices will depend on regulation, technological development, and global demand for digital assets.
4. How much will 1 Bitcoin be worth in 2030 in INR?
The value of Bitcoin in INR by 2030 will depend on both Bitcoin's USD price and the USD-INR exchange rate at that time. If Bitcoin continues gaining adoption globally, its value in Indian Rupees could increase substantially, although future prices remain uncertain.
5. What is the Bitcoin price prediction for 2027?
Bitcoin's 2027 outlook is often linked to post-halving market cycles, institutional participation, and broader crypto adoption. Many analysts view 2027 as a potential growth period, though price movements will continue to be influenced by market conditions and investor sentiment.
6. What is the Bitcoin price prediction for 2040?
Bitcoin price predictions for 2040 are highly speculative due to the long time horizon. Optimistic forecasts are based on increasing scarcity, global adoption, and its potential role as a digital store of value. However, future prices remain impossible to predict with certainty.
7. Is Bitcoin predicted to go up or down?
Bitcoin can move in either direction depending on market conditions. Bullish factors include institutional demand, ETF adoption, and limited supply, while bearish factors may include macroeconomic uncertainty, regulatory changes, and reduced investor risk appetite.
8. Are Bitcoin price predictions on Reddit reliable?
Bitcoin discussions on Reddit can provide useful insights into market sentiment and community trends, but they should not be treated as financial advice. Investors should combine community opinions with technical analysis, on-chain data, and fundamental research before making decisions.
9. What factors influence Bitcoin price predictions?
Bitcoin price predictions are influenced by ETF inflows and outflows, institutional adoption, market liquidity, macroeconomic events, interest rates, regulations, mining activity, and overall investor sentiment. Technical indicators such as RSI, moving averages, and support-resistance levels are also commonly used.
10. Is Bitcoin a good long-term investment?
Many investors view Bitcoin as a long-term asset due to its fixed supply and growing adoption. However, it remains a volatile asset, and investment decisions should be based on individual financial goals, risk tolerance, and thorough research.


