


Binance Coin (BNB) is trading near $604 after clearing its 100-day EMA at $602.20, the level that rejected two rally attempts earlier this month, with the 20-day EMA also crossing back above the 50-day. The RSI has climbed to 64.47 and the MACD histogram has widened to 2.52, signaling a breakout confirmed by momentum but not yet by volume. This Binance Coin price analysis covers short-term and long-term BNB trends with daily, weekly, 2026, 2030, and 2040 forecasts. This BNB Crypto price prediction explores potential price targets, support and resistance levels using technical indicators like RSI, MACD, moving averages, and momentum signals. Track BNB market direction, possible breakout zones, and future scenarios based on current chart patterns and technical structure.
Binance Coin (BNB) is currently trading at $611.11, reflecting a steady market sentiment as of August 14, 2026. The 14-day RSI stands at 64.20, having backed away from the overbought threshold, while the 50-day and 200-day EMAs are positioned at $589.15 and $645.19, respectively. The MACD is positive at 8.92 with its signal line at 6.32, leaving a histogram of 2.60. Based on these technical indicators and broader market trends, BNB is expected to consolidate near $605 to $622 while testing resistance around $635 before a possible breakout or pullback.
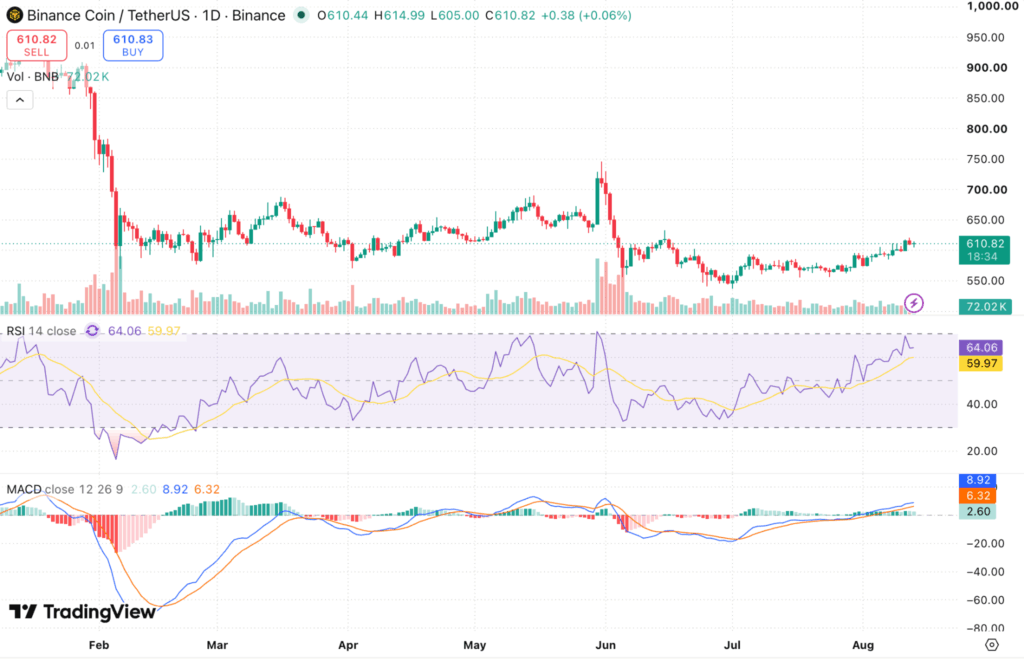
BNB/USDT, Source: TradingView
Key Insights
- BNB may trade between $592 and $645 this week as price consolidates above the $602.72 100-day EMA rather than extending immediately.
- For August 2026, BNB targets $658 just above the 200-day EMA at $645.19, with the $602 zone the level that must hold for that path to stay open.
- By 2026 and 2030, long-term movement will depend on market cycles, but the current technical setup shows BNB recovering from below all major moving averages to reclaim every line except the 200-day.
- Current technical analysis: RSI has cooled to 64.20 without price giving back its gains, the MACD line is still rising, and the 200 EMA at $645.19 sits 5.6% overhead as the last structural ceiling.
Binance Coin Short-Term Price Prediction: Today, This Week, August 2026
Here is the BNB Coin price prediction 2026 for today, this week, and August 2026.
| Timeframe | Price Target | Support | Resistance | ROI |
|---|---|---|---|---|
| Next 24 Hrs | $622 | $605 | $635 | +1.78% |
| This Week | $635 | $592 | $645 | +3.91% |
| August 2026 | $658 | $592 | $675 | +7.67% |
Check out our guide on how to buy binance coin in India
BNB Price Prediction Today
Binance Coin is trading at $616.14 and is expected to range between $602 and $640 in the next 24 hours. The RSI sits at 68.89 and the 100 EMA at $602.39, now well below price, signals firm short-term momentum that is close to stretched. A hold above $602 support targets $640 upside, while a break below risks a drop toward $595.
Trade BNB in INR on 
Deposit and withdraw in INR (₹).
No Conversion to Crypto Required.

Binance Coin Price Prediction for This Week
Binance Coin is projected to trade between $595 and $650 for the week of August 12 to August 18, 2026. BNB has pulled clear of the 100-day EMA at $602.39 and the 20-day EMA at $590.00 sits above the 50-day EMA at $587.32, with the MACD line at 7.91 above its signal at 4.95 and the histogram widening to 2.96, pointing to momentum still building. A weekly close above $650 resistance opens the path toward the 200-day EMA at $645.88, while a loss of $595 support targets $585.
BNB Price Prediction for August 2026
Binance Coin’s August 2026 price prediction targets $660, with a range of $595 to $680. BNB is below its 200-day EMA at $645.88 by under 5%, and the monthly RSI around 68.89 signals strong but stretched conditions. A monthly close above $680 resistance would confirm stronger bullish momentum heading into the next phase.
Binance Coin Price Prediction for September 2026
Binance Coin’s September 2026 price prediction targets $668, with a range of $600 to $685. BNB is below its 200-day EMA at $646.22, and the monthly RSI around 64 signals firm conditions. A monthly close above $685 resistance would put BNB clear of that 200-day EMA and confirm bullish momentum heading into Q4 2026.
BNB Price Prediction 2026 (Medium Term)
| Month | Price Target | Support | Resistance | ROI |
|---|---|---|---|---|
| Aug 2026 | $648 | $572 | $665 | +7.84% |
| Sep 2026 | $665 | $590 | $685 | +10.67% |
| Oct 2026 | $680 | $610 | $700 | +13.17% |
| Nov 2026 | $695 | $630 | $715 | +15.67% |
| Dec 2026 | $710 | $650 | $730 | +18.16% |
Binance Coin’s 2026 price range is projected at $572 to $730, based on the current technical structure. The 50-day EMA at $583.37 is now first support, while the 100-day EMA at $602.27 is the key bull and bear line, sitting directly on the $600 to $610 shelf that acted as the floor from February through May before June broke it. Price is testing that level now after being turned away from it a week ago. A clean break above it targets the 200-day EMA at $648.37 and then $700 to $730, while a loss of the $572 support zone risks a drop back toward $555. Weekly MACD sits above both its signal line and the zero line and RSI is well clear of the midline, suggesting momentum is with buyers.
Binance Coin Price Prediction 2026 to 2040 (Long Term)
| Year | Price Target | Support | Resistance | ROI |
|---|---|---|---|---|
| 2027 | $720 | $650 | $780 | +21.30% |
| 2028 | $780 | $710 | $850 | +31.41% |
| 2029 | $850 | $770 | $930 | +43.21% |
| 2030 | $920 | $830 | $1,020 | +55.00% |
| 2031 | $1,000 | $900 | $1,110 | +68.48% |
| 2035 | $1,250 | $1,090 | $1,450 | +110.60% |
| 2040 | $1,550 | $1,340 | $1,850 | +161.14% |
Binance Coin 2030 Forecast: What Is the Expected Price?
Binance Coin’s BNB price prediction 2030 targets $920, within a range of $830 to $1,020, based on a long-term recovery scenario that the latest chart has started to support. The current price structure, with BNB back above its 20-day and 50-day EMAs but still under the 100-day and 200-day lines, marks an early-stage recovery rather than a confirmed uptrend, so the 2030 figure still leans on market cycles more than on today’s chart. The provided charts also do not contain sufficient data to validate specific Stock-to-Flow or Power Law model ranges, so these long-term projections should be treated as scenario-based estimates.
Binance Coin 2031 Outlook and Expected Price Range
The Binance Coin price prediction for 2031 targets $1,000, with a range of $900 to $1,110, assuming BNB clears its 100-day and 200-day EMAs and holds those levels through the rest of 2026. The BNB price outlook remains dependent on sustained momentum, volume trends, and broader crypto market strength, and the current setup, with MACD approaching a zero-line crossover and price above the shorter EMAs, marks a firmer starting point than the market has offered since June. Long-term projections remain highly uncertain because the supplied chart only shows current technical indicators.
BNB Price Prediction 2040: Long-Term Forecast
By 2040, Binance Coin’s price is projected at $1,550, ranging from $1,340 to $1,850, under a long-term adoption scenario. The current chart shows BNB trading above its 50-day EMA at $581.94 but still below its 200-day EMA at $652.09, with the MACD only just approaching positive territory, so this horizon depends far more on ecosystem growth and market cycles than on present technical structure. The BNB price forecast for 2040 is highly uncertain and should therefore be interpreted as a scenario range rather than a fixed target.
Binance Coin Technical Analysis
The following technical indicators were used to derive the price predictions above. Each indicator’s value and signal should be updated at the time of publishing.
| Indicator | Value | Signal |
|---|---|---|
| Relative Strength Index (14-Day RSI) | 64.20 | Bullish |
| 20-Day EMA | $593.82 | Bullish |
| 50-Day EMA | $589.15 | Bullish |
| 100-Day EMA | $602.72 | Bullish |
| 200-Day EMA | $645.19 | Bearish |
| MACD | 8.92 | Bullish |
| MACD Histogram | 2.60 | Positive, narrowing |
| Average Trading Volume (14-Day) | Moderate | Cooling |
Relative Strength Index (RSI)
The 14-day RSI is at 64.20, down from 68.89 two sessions ago and comfortably above its own average at 59.98. The reading has stepped back from the 70 overbought threshold without price giving up ground, which is how a rally resets rather than reverses. It also removes the immediate parallel with June, when RSI stalled near 71 and price reversed sharply from there.
Moving Averages (50-Day and 200-Day EMA)
BNB is holding above its 100-day EMA at $602.72, with the 20-day EMA at $593.82 above the 50-day EMA at $589.15 and all three stacked beneath price. Only the 200-day EMA at $645.19 sits overhead, roughly 5.6% away, and it is the last structural hurdle before the June range highs. That line has been declining since February, so it falls toward price as much as price rises toward it, which shortens the distance the rally needs to cover.
MACD (Moving Average Convergence Divergence)
The MACD is positive at 8.92 with its signal line at 6.32, leaving a histogram of 2.60 that has narrowed slightly as the signal line catches up. The MACD line itself is still rising, so the narrowing reflects a pause in the rate of advance rather than a loss of direction, and both lines remain well above zero.
Volume Analysis
Binance Coin’s volume has receded from the surge that accompanied Wednesday’s advance, which is normal on a consolidation day and not in itself a warning. What matters is that the earlier breakout was backed by genuine participation, so the $602 zone has a stronger claim as support than it did a week ago. A renewed push toward the 200-day EMA would need turnover to expand again to carry through that level.
Disclaimer: This article is for informational purposes only and does not constitute financial or investment advice. Crypto markets are highly volatile. Always do your own research (DYOR) before making any investment decisions.
FAQs
1. Can Binance Coin (BNB) Reach $10,000?
A $10,000 BNB price would require substantial growth in Binance ecosystem adoption, on-chain activity, and overall crypto market capitalization. While possible in a highly bullish long-term scenario, it would likely depend on sustained institutional adoption and broader market expansion.
2. How Much Will Binance Coin Be Worth in 2030?
BNB's value in 2030 will depend on market conditions, Binance ecosystem growth, regulatory developments, and crypto adoption. Many analysts remain optimistic about BNB's long-term outlook, though future prices remain speculative.
3. Can BNB Reach $5,000?
BNB reaching $5,000 would require significant upside from current levels and continued demand for Binance Smart Chain (BNB Chain) applications. A strong crypto bull market and growing utility could support higher valuations over time.
4. What Is the Binance Coin Price Prediction for Tomorrow?
Short-term BNB price movements depend on market sentiment, Bitcoin's trend, trading volume, and broader crypto market conditions. Traders often monitor support and resistance levels, RSI, and moving averages for daily price forecasts.
5. What Is the Binance Coin Price Prediction for 2027?
The BNB price prediction for 2027 remains largely bullish among market observers, supported by Binance ecosystem growth, DeFi adoption, and increasing use cases for BNB. However, actual performance will depend on market cycles and regulatory developments.
6. What Is the Binance Coin Price Prediction for 2030 in INR?
BNB's 2030 value in INR will depend on both the BNB/USD price and the USD-INR exchange rate. Investors should monitor long-term crypto adoption trends and currency fluctuations when evaluating future BNB valuations.
7. What Is the Binance Coin Price Prediction for 2040?
Long-term forecasts suggest BNB could benefit from continued blockchain adoption, decentralized finance growth, and expanding utility across the Binance ecosystem. However, 2040 price predictions should be viewed as highly speculative.
8. What Is the Binance Coin Price Prediction for 2050?
Predicting BNB's value in 2050 is challenging due to evolving technology, regulations, and market conditions. Long-term projections generally assume continued cryptocurrency adoption and ecosystem development.
9. How high will BNB go in 2026?
Our projection puts BNB's 2026 range at $542 to $670, with the year-end target at $655. More bullish third-party platforms forecast considerably higher levels, though those assume a market recovery that the current price structure does not yet support. Projections rely heavily on deflationary token burns, regulatory milestones, and institutional adoption via potential spot ETFs.
10. What will be BNB price prediction 2026 in rupees?
The BNB price prediction for 2026 forecasts a trading range between roughly Rs 47,000 and Rs 58,000 ($542 to $670), based on a USD-INR rate near Rs 87. That places the year-end target close to Rs 57,000, though exact figures depend heavily on overall crypto market momentum and USDT-INR exchange rates.
11. What is BNB price prediction in 2026 per Wallet Investor?
Wallet Investor projects BNB to trade at an average price of around $585 by mid-2026. Their algorithmic forecast anticipates a short-term drop in the coming days, with a low target of roughly $578 and a high of $617.