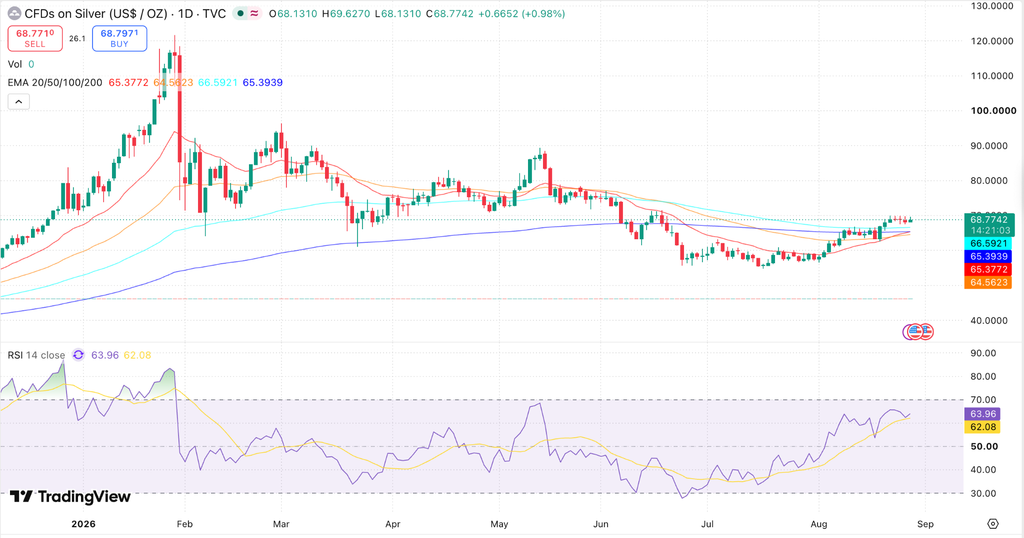
Silver is trading near $68.77 per troy ounce on 27 August 2026, up 0.98% on the session after opening at its low of $68.13 and running as high as $69.63. The metal now sits above all four major moving averages, with the 20-day EMA at $65.38, the 50-day at $64.56, the 100-day at $66.59 and the 200-day at $65.39. The 20-day EMA is still less than two cents below the 200-day and the 100-day remains the highest of the four, so the moving-average stack has not yet reordered into a clean uptrend. A daily close above $70 opens the mid-$70s. A loss of the $65.38 shelf would put the recovery back in question.
Silver Price Today: Live Snapshot
| Metric | Value on 27 August 2026 |
|---|---|
| Silver price (XAG/USD) | $68.77 |
| Daily open | $68.13 |
| Day high | $69.63 |
| Day low | $68.13 |
| Daily change | +0.98% |
| Immediate resistance | $69.63, then $70.00 |
| Major resistance | The mid-$70s breakdown zone |
| Immediate support | $66.59 (100-day EMA) |
| Next support | $65.38 to $65.39 (20-day and 200-day EMA shelf) |
| RSI (14) | 63.96 |
| Short-term outlook | Constructive, not yet confirmed |
Spot values read from the daily XAG/USD chart during the IST afternoon session on 27 August 2026. The daily candle was still open at the time of writing. Domestic retail rates exclude GST and making charges and differ across cities.
Why Are Silver Prices Rising Today?
Silver is climbing on a weaker US dollar and a cooling energy market. A softer dollar makes the metal cheaper for buyers outside the United States, while falling oil reduces the inflation pressure that has kept the Federal Reserve from cutting rates, which in turn lowers the cost of holding an asset that pays no income. The move has recovered the previous session’s losses and carried silver to its strongest levels in roughly two months. Four factors are doing most of the work.
- A weaker dollar: The US Treasury doubled its liquidity-support buyback operations for longer-dated notes and bonds, a move that pushed the dollar to a more than three-month low. For Indian buyers the effect is partly muted, because a weaker dollar tends to lift the rupee and offset some of the gain once the price is converted.
- Falling oil: Crude has declined for a third consecutive session, with Brent slipping under $86 a barrel after talks between Iran and Oman on Strait of Hormuz shipping. Cheaper energy cools the inflation impulse that has kept the Federal Reserve hawkish.
- Steady industrial demand: Photovoltaic solar, electric vehicles and the build-out of AI data-centre infrastructure continue to absorb physical silver, which supports the floor even when investment flows turn choppy.
- Positioning into Jackson Hole: Fed Chair Kevin Warsh speaks at the symposium on 28 August. He is not expected to give firm guidance on the September decision, so traders have been reluctant to hold large short positions in precious metals into the event.
July PCE data released this week showed that inflation came in hotter than forecast, with the headline rate at 3.7% against expectations of 3.6% and core at 3.3% year on year. Markets now price roughly a 60% chance the Fed leaves rates unchanged next month, down from 64% before the print, and a minority still price a hike. Higher-for-longer rates work against silver, so the current rally is leaning on dollar weakness. The same energy and inflation channel runs through other risk assets.
For how it works in practice, read How Rising Oil Prices Affect Crypto.
Silver Has Cleared Every Major Moving Average
Silver is trading above the 20-day, 50-day, 100-day and 200-day EMAs at the same time, the first constructive structure the chart has offered since the June breakdown. The 20-day EMA at $65.3772 sits just under two cents below the 200-day at $65.3939, so the short-term average has not quite crossed the long-term one. The 100-day EMA at $66.59 is still the highest of the four, which is the signature of a market that fell hard and is only now working its way back.
| Indicator | Value | Signal |
|---|---|---|
| 20-day EMA | $65.38 | Support, converging with the 200-day |
| 50-day EMA | $64.56 | Deeper support |
| 100-day EMA | $66.59 | Immediate support and the highest EMA |
| 200-day EMA | $65.39 | Trend reference, now reclaimed |
| RSI (14) | 63.96 | Bullish, six points short of overbought |
| RSI average | 62.08 | Momentum still improving |
| MACD line | 2.1166 | Above its signal at 1.6701 |
| MACD histogram | +0.4465 | Positive and expanding |
| EMA structure | Price above all four EMAs | Stack not yet reordered |
Indicator values read from the daily XAG/USD chart on 27 August 2026. The daily candle was still open at the time of writing. This price feed does not publish volume, so no volume reading is quoted.
Silver/USD, Source: TradingView.
Silver is 5.20% above its 20-day EMA, 6.52% above the 50-day, 3.28% above the 100-day and 5.17% above the 200-day. The RSI at 63.96 sits above its own average of 62.08 and below the overbought threshold of 70, which leaves roughly six points of headroom before the reading starts to look stretched. The MACD line at 2.1166 is above its 1.6701 signal, and the histogram at plus 0.4465 has been widening, so buyers have been adding rather than fading the move.
The zone where the 20-day and 200-day EMAs meet is the level worth watching. Two averages separated by 0.02% of spot form an unusually narrow shelf around $65.38. If silver holds above that shelf, the 20-day should complete its cross above the 200-day and the trend structure improves materially. If the shelf gives way, both averages fail at once and the recovery loses its technical footing in a single move.
Silver Price Forecast for Today, Tomorrow and the Weeks Ahead
Each row below pairs a bias with the level that confirms it and the level that invalidates it, so the table can be refreshed as price crosses each threshold.
| Timeframe | Silver price outlook | Bullish trigger | Downside risk |
|---|---|---|---|
| Today | Constructive above $68.13 | Close above $69.63 | Slip back under $66.59 |
| Tomorrow | Breakout-dependent | Daily close above $70.00 | Rejection at the $69.63 high |
| Next week | Extension toward the mid-$70s | Sustained trade above $70.00 | Break below $65.38 |
| September 2026 | Trend turn unconfirmed | 20-day EMA closing above the 100-day | Daily close below $64.56 |
Technical values are based on the daily XAG/USD chart supplied for 27 August 2026, with the daily candle still open at the time of observation.
Bullish scenario: A daily close above the session high of $69.63 puts the round $70 level in immediate reach. Clearing $70 on a closing basis would leave the mid-$70s zone, where the June breakdown began, as the next meaningful band of supply. That path needs the dollar to stay soft and the 20-day EMA to complete its cross above the 200-day.
Bearish scenario: Failure at $69.63 followed by a close beneath the 100-day EMA at $66.59 would signal that the bounce is running out of buyers. The decisive level below that is the $65.38 to $65.39 shelf where the 20-day and 200-day EMAs converge. Losing it would expose the 50-day EMA at $64.56 and reopen the path toward $60.
Silver Price Forecast 2026: Full-Year Outlook
J.P. Morgan Global Research cut its silver numbers on 13 August, taking the 2026 annual average down to $70.60 an ounce from $84.30 set in May, a reduction of 16%. The bank’s fourth-quarter 2026 forecast fell harder still, from $90.00 to $63.00, a 30% cut, and its 2027 average dropped from $85.80 to $63.90.
| Source | Figure | Versus spot | Type of number |
|---|---|---|---|
| Current spot | $68.77 | Reference | Live market |
| J.P. Morgan, 2026 | $70.60 | +2.7% | Annual average, revised 13 August |
| J.P. Morgan, Q4 2026 | $63.00 | -8.4% | Quarterly average |
| J.P. Morgan, 2027 | $63.90 | -7.1% | Annual average |
| Reuters analyst poll | $72.00 | +4.7% | Analyst average of 29 respondents, late July |
Silver spent the first half of 2026 well below where it trades now, so a full-year average of $70.60 remains compatible with the metal finishing the year higher than that figure. At $63.00, J.P. Morgan is forecasting silver to trade below today’s spot by the end of the year.
The bank grounds the downgrade in the unwinding of physical market tightness, a roughly 30% fall in solar demand for silver this year that amounts to about 60 million ounces year on year, Chinese destocking after March import front-running ahead of the removal of an export VAT rebate on photovoltaic products, weaker Indian demand following the import duty increase, and wider adoption of silver-thrifting technologies that reduce the metal loading in each solar panel.
CoinDCX view: Silver has now traded above the level the most-cited bank on the street expects it to end the year at. That does not make the rally wrong, but it does shift the burden of proof onto the buyers. The bullish case needs the dollar to keep weakening and the physical deficit to reassert itself against falling solar demand. Clearing $70 and holding it would be the first evidence that the market disagrees with the sell-side. Failing there would suggest the August move was a positioning bounce inside a larger downtrend.
Sources: J.P. Morgan Global Research silver price forecast and the Reuters analyst poll from late July.
Silver Price Forecast 2027 to 2030: Year-by-Year Outlook
Silver’s long-term direction will depend on investment demand, real interest rates, industrial consumption, mine supply and recycling. The table below presents three CoinDCX scenario paths for XAG/USD rather than guaranteed price targets or analyst consensus.
| Year | Downside scenario | Base scenario | Upside scenario |
|---|---|---|---|
| 2027 | $50 to $65 | $65 to $75 | $85 to $95 |
| 2028 | $45 to $60 | $65 to $82 | $90 to $115 |
| 2029 | $45 to $60 | $70 to $90 | $105 to $135 |
| 2030 | $45 to $60 | $75 to $95 | $120 to $160 |
The base scenario assumes that silver-market deficits persist but that recycling, industrial substitution and slower photovoltaic demand limit the pace of price growth. The downside scenario assumes higher real interest rates, a stronger US dollar and faster industrial substitution. The upside scenario would require sustained investment inflows, tighter physical inventories and significant gold-to-silver ratio compression.
J.P. Morgan’s 2027 average of $63.90 sits inside the downside band above, below the $65 floor of the base case. Anyone weighing the two should treat this base case as contingent on the physical deficit reasserting itself rather than as a settled consensus view.
The 2027 range is informed by current published outlooks. WisdomTree expects silver to move toward approximately $70, while Citi sees a possible move to $95 but also assigns downside risk near $50. Estimates for 2028 through 2030 are CoinDCX scenario extensions and should not be presented as institutional forecasts.
Sources: WisdomTree silver outlook to Q2 2027 and Citi Research comments reported by The Wall Street Journal.
Silver Price Forecast in India: MCX and INR Outlook
Indian silver prices are driven by international XAG/USD, the USD/INR rate, customs duty, GST, contract expiry and local premiums. India raised the effective customs duty on gold and silver from 6% to 15% in May 2026, and physical purchases can attract a further 3% GST. Futures and retail quotations follow different pricing conventions, so the same international price produces several different rupee numbers depending on which one you are looking at.
At the time of writing the rupee is near ₹95.4 to the US dollar. On the domestic market, MCX silver futures are quoted around ₹2,43,399 per kg, while indicative retail rates for 999 purity silver sit near ₹2,60,000 per kg once dealer premiums are included.
How International Silver Converts to INR
A simplified physical-price estimate is: international silver price, multiplied by 32.1507 troy ounces per kg, multiplied by USD/INR, multiplied by the customs-duty adjustment, multiplied by the GST and premium adjustment.
Applying that to the current spot of $68.77 at ₹95.4 gives roughly ₹2,42,584 per kg on a duty-inclusive basis, which lands within 0.4% of the live MCX quote. Adding 3% GST takes the figure to about ₹2,49,862 per kg, with the balance up to the ₹2,60,000 retail level accounted for by dealer premium.
What the Key Levels Look Like in Rupees
The table below converts the technical levels discussed earlier into rupee terms so the chart can be read alongside a domestic quote.
| International level | MCX-equivalent (₹/kg) | Retail-equivalent (₹/kg) |
|---|---|---|
| $64.56 (50-day EMA) | ₹2,27,728 | ₹2,34,559 |
| $65.39 (200-day EMA) | ₹2,30,661 | ₹2,37,581 |
| $66.59 (100-day EMA) | ₹2,34,887 | ₹2,41,934 |
| $68.77 (spot) | ₹2,42,584 | ₹2,49,862 |
| $70.00 (round resistance) | ₹2,46,908 | ₹2,54,315 |
| $75.00 (mid-$70s zone) | ₹2,64,544 | ₹2,72,480 |
| $80.00 (psychological) | ₹2,82,180 | ₹2,90,646 |
Conversions use a USD/INR rate of approximately ₹95.4, a 15% customs duty and, for the retail column, a further 3% GST. Rate, duty or tax changes will move every figure in this table, so the calculation should be re-run rather than carried forward.
MCX Silver Contract Sizes
- Standard Silver futures: 30 kg
- Silver Mini futures: 5 kg
- Silver Micro futures: 1 kg
Leverage magnifies both gains and losses. MCX futures suit investors and hedgers who understand commodity derivatives, margin calls and contract expiry.
Gold-to-Silver Ratio: What It Means Now
With gold near $4,602 and silver at $68.77, the gold-to-silver ratio stands at roughly 66.9. The ratio has compressed modestly through August as silver has held its ground on down days for gold, which is a change from the pattern earlier in the year when silver fell harder whenever gold slipped.
J.P. Morgan expects the ratio to normalise toward 70 over the second half of 2026 and toward 75 during 2027, on the view that a Fed which is holding or hiking raises the opportunity cost of holding non-yielding metals and that gold’s central-bank demand cushions it in a way silver’s does not. If gold were to stay near $4,602, a ratio of 70 implies silver around $65.74 and a ratio of 75 implies roughly $61.36. Both sit below the current price, which is a concrete way of seeing why the bank’s fourth-quarter number is where it is.
Ratio compression can happen because silver rises, gold falls, or both move at different speeds. It works best alongside price trends, monetary policy, industrial data and investment flows rather than as a standalone signal.
Silver vs Gold: Which Is Better?
| Factor | Silver | Gold |
|---|---|---|
| Primary demand mix | Industrial plus investment demand | Investment, jewellery and central-bank demand |
| Volatility | Generally higher | Generally lower than silver |
| Industrial sensitivity | High | Limited |
| Drawdown from 2026 record | About 43.5% below the $121.64 January high | About 17.8% below the $5,597 January high |
| Relative valuation indicator | Gold-to-silver ratio near 66.9 | Reference asset in the ratio |
| Main risk | Demand destruction and large price swings | Real yields, dollar strength and weaker safe-haven demand |
Also read: Gold Price Forecast for 2026.
Is Silver a Good Investment Right Now?
Silver suits investors who understand how sharply it can move and who want exposure to both precious-metal and industrial demand.
Bull Case
- A sixth consecutive annual market deficit keeps the physical balance tight, and each successive deficit draws down above-ground stocks further.
- Silver remains about 43.5% below its January record of $121.64, which leaves considerable room for recovery if investment demand returns.
- AI data-centre build-out, electronics and electric vehicles may support longer-term industrial demand even as solar thrifting reduces the metal loading per panel.
- A weaker dollar or falling real yields would improve the backdrop for the whole precious-metals complex, and the dollar has already reached a three-month low.
Bear Case
- J.P. Morgan forecasts silver at $63.00 in the fourth quarter of 2026, which is below the current spot price, and cut its 2027 average by 25.5% in the same revision.
- Solar demand for silver is projected to fall by roughly 30% this year, a reduction of about 60 million ounces, as thrifting technologies spread and Chinese buyers work through inventory.
- July PCE inflation came in above forecast, and a portion of the market still prices a Federal Reserve rate hike rather than a cut, which raises the cost of holding a non-yielding asset.
- Silver has already demonstrated that it can lose more than half its value from a speculative peak, and recycling supply tends to rise when prices are elevated.
Time horizon, liquidity needs, product costs, tax treatment and position size all matter more for silver than for lower-volatility holdings.
How to Invest in Silver in India
Silver is among the more accessible investments available to Indian investors, and the route chosen affects cost, liquidity and tax treatment as much as the price itself.
- Physical silver: Coins, bars and jewellery bought through jewellers, banks and government-linked mints. Investment-grade purity is standardised at 99.9%. This route carries 3% GST on purchase, making charges on jewellery and a storage requirement, so it suits investors who specifically want tangible ownership.
- Silver ETFs on NSE: Exchange-listed funds that hold vaulted physical silver and track the spot price. They trade like shares through a demat account, need no storage and remain the cleanest liquid option for most investors. Prices and NAVs move daily, so live market data should be checked before any decision.
- MCX futures: Standard 30 kg, mini 5 kg and micro 1 kg contracts, with leverage that amplifies both gains and losses. Appropriate only for investors comfortable with margin, expiry and daily mark-to-market.
- Digital silver: Fractional purchases stored in a vault on the investor’s behalf, available from as little as ₹1. Convenient for systematic, small-ticket accumulation without storage overhead.
For silver-linked market exposure without physical delivery, B-XAG/USDT Futures are available on CoinDCX, an FIU-IND registered platform.
Disclaimer
This article is for informational and educational purposes only. It does not constitute financial, investment, or trading advice. Precious metal and digital asset markets involve significant risk. Please do your own research and consult a financial advisor before making any investment decisions.
FAQ
1. What is the silver price today in India?
Silver in India is quoted around ₹2,43,399 per kg for MCX futures on 27 August 2026, while indicative retail rates for 999 purity silver sit near ₹2,60,000 per kg. Retail rates vary by city, dealer and applicable taxes, so the local quote will rarely match the exchange figure exactly. Internationally, spot silver is trading near $68.77 per ounce.
2. Why did the silver price fall in 2026?
Silver fell about 43.5% from its January 2026 record of $121.64 per ounce for three main reasons. Exchange margin requirements on silver futures were raised, which forced leveraged holders to sell. The US dollar strengthened as the Federal Reserve signalled it was in no hurry to cut rates. Profit-taking after silver’s extraordinary run through 2025 then compounded both effects into a sustained correction.
3. Will silver price increase in 2026?
A Reuters poll of 29 analysts and traders in late July put the 2026 average at $72, above the current price, while J.P. Morgan cut its fourth-quarter forecast to $63.00 on 13 August, which is below the current price. The bullish case rests on a weaker dollar and a persistent physical deficit. The bearish case rests on falling solar demand and a Federal Reserve that may hold or hike rather than cut.
4. What is the silver price forecast for 2030?
Silver’s 2030 base scenario runs from $75 to $95 per ounce, with a downside path of $45 to $60 and an upside path of $120 to $160. At the current rupee rate and duty structure, the base scenario corresponds to roughly ₹2,64,500 to ₹3,35,000 per kg. Long-range projections of this kind carry substantial uncertainty and should be treated as scenarios rather than targets.
5. Is silver better than gold right now?
Silver has been holding its ground against gold through August, with the gold-to-silver ratio compressing to about 66.9. Silver also sits roughly 43.5% below its record while gold is only about 17.8% below its own, which leaves more room for recovery if flows return. Silver is considerably more volatile, so gold remains the steadier holding for investors who prioritise capital preservation.
6. How does oil price affect silver?
Oil affects silver mainly through the inflation and interest rate channel. Expensive oil raises inflation, which reduces the likelihood of rate cuts, strengthens the dollar and makes silver costlier for non-dollar buyers. That mechanism is currently working in silver’s favour: Brent has fallen for a third consecutive session to below $86 a barrel, easing inflation concerns. Geopolitical events that spike oil can simultaneously drive safe-haven demand.
7. What is the silver price prediction for the next 5 years?
Silver’s five-year outlook spans a downside of $45 to $60 and an upside of $120 to $160, with the base path building from $65 to $75 in 2027 toward $75 to $95 by 2030. That corresponds to roughly ₹1,58,000 to ₹5,64,000 per kg at the present rupee and duty structure. The width of that range reflects real disagreement about supply deficits, the pace of the energy transition and Federal Reserve policy.
8. Will silver reach ₹5 lakh per kg?
Silver reaching ₹5 lakh per kg would require the international price to reach somewhere between $138 and $142 per ounce at the current ₹95.4 rupee rate, 15% customs duty and 3% GST structure. That level sits above the all-time high of $121.64 and above every mainstream forecast for 2026 and 2027, which places it firmly in the upside scenario rather than the base case.
9. Why are silver prices rising in August 2026?
Silver prices are rising in August 2026 because the US Treasury doubled its buyback operations for longer-dated debt, pushing the dollar to a three-month low, while oil has fallen for three consecutive sessions and eased inflation pressure. Technically, silver has reclaimed all four of its major moving averages and is holding above the 200-day EMA at $65.39. The metal is up roughly 9% from the $62.96 level it traded at just over a week ago.
10. What is the silver MCX price prediction for the rest of 2026?
MCX silver pricing for the rest of 2026 depends on whether the international price holds above $70. A move into the $70 to $75 zone works out near ₹2,46,900 to ₹2,64,500 per kg at the current rupee level and duty structure. A failure at $70 that returns spot toward the J.P. Morgan's fourth-quarter forecast of $63.00 would put MCX pricing closer to ₹2,22,200 per kg.