

Stellar crypto price prediction suggests XLM could remain bullish if it holds above its 200-day moving average while the MACD stays positive. This guide covers Stellar price forecasts for today, this week, monthly projections for 2026, and long-term estimates through 2040. It also includes technical analysis using RSI, MACD, moving averages, key support and resistance levels, and potential upside scenarios based on the current market trend.
Stellar (XLM) is currently trading at $0.1986, reflecting a bullish market sentiment as of 1 July 2026. The 14-day RSI stands at 45.25, signaling neutral conditions, while the 50-day and 200-day moving averages are positioned at $0.19895 and $0.19137, respectively. The MACD is positive, indicating bullish short-term momentum. Based on these technical indicators and broader market trends, XLM is expected to test resistance near $0.2000-$0.2050 while holding above the $0.1960 support zone.
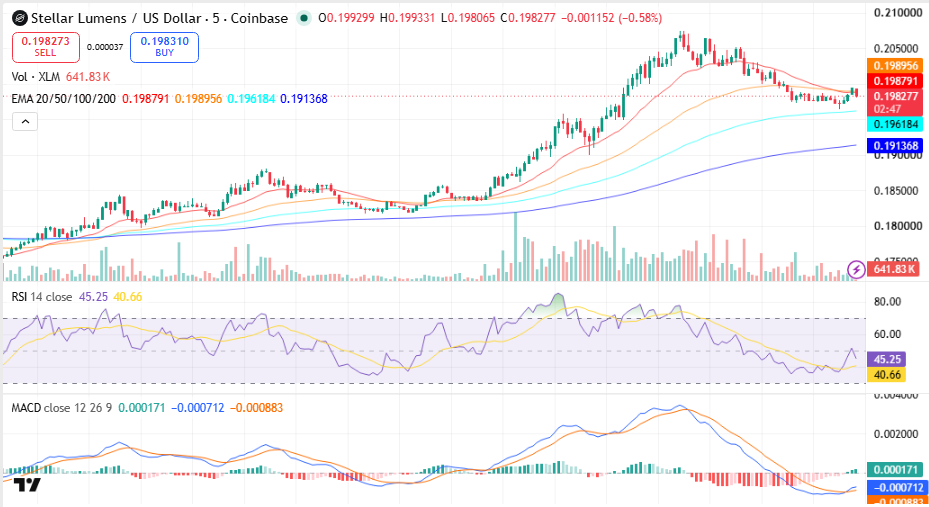
XLM/USD, Source TradingView
Key Insights
- Short-term (Week & July 2026): XLM remains above its 200-day MA, suggesting a positive medium-term structure. A move above $0.2000 could trigger further upside toward $0.2050.
- 2026 & 2030 Outlook: Based on the current trend alone, XLM maintains a constructive outlook as long as it trades above the 200-day moving average. Long-term projections require additional macro and on-chain data beyond this chart.
- Technical Analysis: RSI at 45.25 indicates neutral momentum, while the MACD has turned positive, suggesting improving buying pressure after the recent pullback.
Read more: What is Stellar Lumens (XLM)?
Stellar Short-Term Price Prediction – Today, This Week, July 2026
Here is the Stellar coin price prediction 2026 for today, this week, and July 2026.
| Timeframe | Price Target | Support | Resistance | ROI |
| Next 24 Hrs | $0.2000 | $0.1980 | $0.2000 | +0.70% |
| This Week | $0.2050 | $0.1960 | $0.2050 | +3.22% |
| July 2026 | $0.2100 | $0.1914 | $0.2100 | +5.74% |
Read also: How to buy Stellar (XLM) in India
Stellar Lumens price prediction Today
Stellar is trading at $0.1986 and is expected to range between $0.1981 and $0.1993 in the next 24 hours. The RSI sits at 45.25 and the 20-EMA at $0.19879 signals bullish short-term momentum. A hold above $0.1980 targets $0.2000; a break below risks a drop to $0.1962.
Stellar Coin Price Prediction for This Week
Stellar is projected to trade between $0.1960 and $0.2050 for the week of 1-7 July 2026. XLM is above the 100-day EMA at $0.19618, with the MACD histogram expanding, pointing to bullish momentum. A weekly close above $0.2050 opens $0.2100; a loss of $0.1960 targets $0.1914.
Stellar Lumens price prediction for July 2026
Stellar’s July 2026 price prediction targets $0.2100, with a range of $0.1914-$0.2100. XLM is above its 200-day MA at $0.19137, and the monthly RSI at 45.25 signals neutral conditions. A monthly close above $0.2050 would confirm bullish momentum heading into Q3 2026.
Trade XLM in INR on ![]()
Deposit and withdraw in INR (₹).
No Conversion to Crypto Required.

Stellar Coin Price Prediction for August 2026
Stellar’s August 2026 price prediction targets $0.2150, with a range of $0.1980-$0.2150. XLM is above its 200-day MA at $0.19137, and the monthly RSI at 45.25 signals neutral conditions. A monthly close above $0.2100 would confirm bullish momentum heading into Q3 2026.
Stellar price prediction 2026 (Medium Term)
| Month | Price Target | Support | Resistance | ROI |
| July 2026 | $0.2100 | $0.1914 | $0.2100 | +5.74% |
| Aug 2026 | $0.2150 | $0.1980 | $0.2150 | +8.26% |
| Sep 2026 | $0.2200 | $0.2050 | $0.2200 | +10.78% |
| Oct 2026 | $0.2250 | $0.2100 | $0.2250 | +13.31% |
| Nov 2026 | $0.2300 | $0.2150 | $0.2300 | +15.81% |
| Dec 2026 | $0.2350 | $0.2200 | $0.2350 | +18.33% |
Stellar’s 2026 price range is projected at $0.1914-$0.2350. The 200-day MA at $0.19137 is the key bull/bear line—a hold above targets $0.2350, while a break below $0.1914 risks a drop to $0.1850. Weekly MACD is positive and RSI is trending below the midline (45.25), indicating improving momentum but with room for further confirmation.
Stellar Lumens price prediction 2026 to 2040 (Long Term)
| Year | Price Target | Support | Resistance | ROI |
| 2027 | $0.32 | $0.24 | $0.38 | +61.1% |
| 2028 | $0.48 | $0.35 | $0.60 | +141.9% |
| 2029 | $0.67 | $0.50 | $0.82 | +237.4% |
| 2030 | $0.95 | $0.72 | $1.10 | +378.2% |
| 2031 | $0.82 | $0.65 | $0.98 | +312.9% |
| 2035 | $1.85 | $1.35 | $2.20 | +831.5% |
| 2040 | $3.80 | $2.90 | $4.50 | +1,814.5% |
Stellar 2030 Forecast: What Is the Expected Price?
Stellar price prediction 2030 targets $0.95, within a range of $0.72-$1.10, assuming XLM continues respecting its long-term uptrend above the 200-day moving average while adoption and market liquidity improve. Based on the current bullish MACD crossover and price holding above the 200 EMA, a gradual expansion toward the psychological $1.00 level appears achievable in a sustained bull market. Conservative trend projection supports a range of $0.72-$1.10 under continued network growth.
Stellar 2031 Outlook and Expected Price Range
The Stellar lumens price outlook for 2031 targets $0.82, with a range of $0.65-$0.98, as the market enters a likely consolidation phase following a strong advance. Cycle analysis suggests 2031 may resemble a post-rally consolidation year, where profit-taking limits rise before the next long-term expansion. Maintaining support above $0.65 would preserve the broader bullish structure.
Stellar 2040 Long-Term Forecast
By 2040, Stellar’s price is projected at $3.80, ranging from $2.90 to $4.50 under a long-term adoption scenario. The Stellar lumens price forecast assumes continued ecosystem growth, broader institutional participation, and sustained demand for blockchain-based cross-border payments. These projections represent long-term scenarios rather than fixed price targets and should be interpreted with caution.
Stellar Technical Analysis
The following technical indicators were used to derive the price predictions above. Each indicator’s value and signal should be updated at the time of publishing.
| Indicator | Value | Signal |
| Relative Strength Index (14-Day RSI) | 45.25 | Neutral |
| 50-Day Moving Average | $0.19895 | Bearish |
| 200-Day Moving Average | $0.19137 | Bullish |
| MACD | 0.000171 | Bullish |
| MACD Histogram | 0.000883 | Positive |
| Average Trading Volume (30-Day) | $470.7M | Increasing |
Relative Strength Index (RSI)
The 14-day RSI is at 45.25, signaling neutral (30-70) conditions. Momentum is gradually recovering from recent weakness, suggesting buyers are returning but the asset is not yet overbought. A sustained move above 50 would strengthen the bullish case.
Moving Averages (50-Day & 200-Day MA)
XLM is slightly below its 50-day moving average at $0.19895 and above its 200-day moving average at $0.19137. This indicates a short-term recovery within a broader bullish trend, with the 50-day MA serving as the first resistance before a move toward $0.205-$0.210.
MACD (Moving Average Convergence Divergence)
The MACD is above the signal line with a histogram of 0.000883, indicating bullish momentum. The expanding positive histogram suggests buying pressure is strengthening after the recent correction.
Volume Analysis
Stellar’s average trading activity remains healthy, with CoinMarketCap showing approximately $470.7 million in 24-hour volume. Increasing volume alongside a positive MACD crossover supports the current recovery and improves the probability of continued upside if price breaks above the 50-day moving average.
Disclaimer: This article is for informational purposes only and does not constitute financial or investment advice. Crypto markets are highly volatile. Always do your own research (DYOR) before making any investment decisions.
FAQs
1. Is Stellar expected to go up?
Stellar (XLM) could see upside if crypto market sentiment improves, adoption of cross-border payment solutions increases, and the broader altcoin market enters a bullish cycle. However, like all cryptocurrencies, XLM remains volatile and its price depends on macroeconomic conditions, regulations, and network growth.
2. Can Stellar reach $1?
Yes, Stellar reaching $1 is possible, especially during strong bull markets. XLM has previously traded above $0.90 in 2018, demonstrating that such levels are achievable under favorable market conditions. However, sustained adoption and favorable market sentiment would be necessary.
3. Can Stellar reach $10?
A $10 price target for Stellar is highly ambitious and would require a massive increase in market capitalization and adoption. While not impossible in the long term, it would likely require widespread use of the Stellar network for global payments and tokenization.
4. Will XLM reach $1 in 2026?
Whether XLM reaches $1 in 2026 depends on overall crypto market conditions, institutional adoption, and network developments. In a strong bull cycle, XLM could potentially test the $1 mark, though investors should consider both bullish and bearish scenarios.
5. What is the Stellar price prediction on CoinDCX today?
CoinDCX's Stellar price prediction is based on technical indicators, market trends, and broader crypto sentiment. Traders should monitor key support and resistance levels, RSI, MACD, and moving averages for short-term price action.
6. What is the XLM Stellar price prediction on CoinDCX?
The CoinDCX XLM price prediction evaluates Stellar's performance using technical analysis, on-chain metrics, and macro trends. While forecasts provide potential price ranges, investors should conduct their own research before investing.
7. What is the Stellar price prediction for 2030?
By 2030, Stellar's price could be influenced by the growth of blockchain-based payment systems and real-world adoption. Long-term forecasts vary widely, with some analysts expecting moderate growth while others project higher valuations under bullish scenarios.
8. What was the Stellar price prediction in 2022?
Stellar price predictions in 2022 were impacted by the broader crypto bear market, rising interest rates, and declining investor sentiment. Historical predictions should be viewed as market snapshots rather than guarantees of future performance.
9. What is the XLM price prediction for 2040?
Predicting XLM's price in 2040 is highly speculative due to the rapidly evolving nature of the crypto industry. Long-term success will depend on Stellar's adoption, technological development, and competition from other blockchain networks.
10. What could XLM be worth in 2030 in INR?
The value of XLM in Indian Rupees (INR) by 2030 will depend on both the XLM/USD price and USD/INR exchange rates. If XLM experiences significant adoption and market growth, its INR value could increase accordingly.
11. What is the latest XLM Stellar price prediction?
The latest XLM price prediction depends on current market trends, trading volume, and technical indicators. Traders often watch resistance levels, moving averages, and overall crypto market momentum to assess Stellar's near-term outlook.
12. What is the XLM price prediction for 2026?
XLM's 2026 price outlook will largely depend on adoption of the Stellar network, macroeconomic trends, and the performance of the broader cryptocurrency market. Analysts typically provide bullish, base, and bearish scenarios rather than a single target.

