


Explore the Re crypto price prediction with daily, weekly, and long-term forecasts from 2026 to 2040. Analyze RE price targets, support, resistance levels, and future trends using technical indicators like RSI, MACD, and moving averages. This detailed forecast covers short-term momentum, 2026 expectations, and long-term scenarios to understand possible price movements based on current market structure and chart analysis.
Re (RE) is currently trading at $0.7136, reflecting a neutral to slightly bearish market sentiment as of 30 June 2026. The 14-day RSI stands at 43.79, signaling neutral conditions with weak momentum. The 50-day and 200-day moving averages are positioned around $0.7162 and $0.7364, respectively. The MACD is negative, indicating bearish short-term momentum, although the histogram is showing early signs of recovery. Based on these technical indicators, RE is expected to consolidate near current levels while attempting to retest resistance around $0.7160-$0.7360.
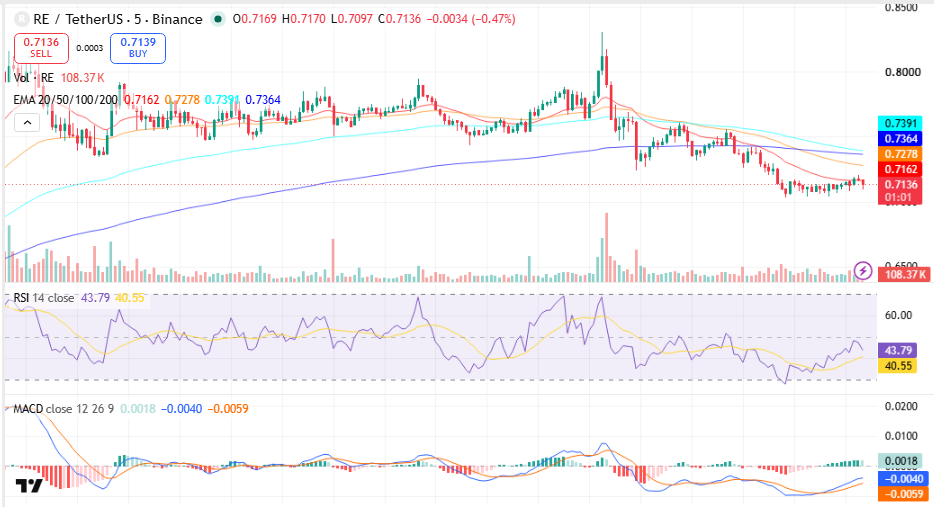
Re live chart, Source TradingView
Key Insights
● RE is trading near $0.7136, with short-term momentum remaining weak as price stays below major moving averages. A breakout above $0.7160 could improve sentiment.
● For the week and July 2026, RE may continue consolidating between $0.7000-$0.7400 unless volume increases and price breaks key resistance levels.
● Technical indicators show RSI at 43.79 and negative MACD, suggesting neutral-to-bearish momentum but with potential recovery if buyers return.
Re Short-Term Price Prediction – Today, This Week, July 2026
Here is the Re coin price prediction 2026 for today, this week, and July 2026.
| Timeframe | Price Target | Support | Resistance | ROI |
| Next 24 Hrs | $0.7160 | $0.7050 | $0.7200 | +0.34% |
| This Week | $0.7250 | $0.7000 | $0.7400 | +1.60% |
| July 2026 | $0.7350 | $0.6800 | $0.7800 | +3.00% |
Re Price Prediction Today
Re is trading at $0.7136 and is expected to range between $0.7050 and $0.7200 in the next 24 hours. The RSI sits at 43.79, showing neutral momentum, while the 20 EMA near $0.7162 signals weak short-term momentum. A hold above $0.7050 support could push RE toward $0.7200 resistance, while a break below may lead to a decline toward $0.7000.
Re Coin Price Prediction for This Week
Re is projected to trade between $0.7000 and $0.7400 for the week of 30 June-6 July 2026. RE is currently below the 50/100-day EMA zone around $0.7162-$0.7278, with the MACD histogram showing negative momentum but signs of improvement. A weekly close above $0.7400 resistance could open the path toward $0.7800, while losing $0.7000 support may target $0.6800.
Trade Crypto in INR on ![]()
Deposit and withdraw in INR (₹).
No Conversion to Crypto Required.

Re Price Prediction for July 2026
Re’s July 2026 price prediction targets $0.7350, with a range of $0.6800-$0.7800. RE is below its 200-day MA at $0.7364, and the monthly outlook remains neutral as current momentum indicators recover slowly. A monthly close above $0.7360-$0.7400 resistance would confirm stronger bullish momentum heading into Q3 2026.
Re Coin Price Prediction for August 2026
Re’s August 2026 price prediction targets $0.7500, with a range of $0.7000-$0.8000. RE needs to reclaim its 200-day MA near $0.7364 to improve market structure. A breakout above $0.7800 resistance may support further upside, while failure to hold $0.7000 could increase selling pressure.
Re Price Prediction 2026 (Medium Term)
| Month | Price Target | Support | Resistance | ROI |
| July 2026 | $0.7350 | $0.6800 | $0.7800 | +3.00% |
| Aug 2026 | $0.7500 | $0.7000 | $0.8000 | +5.10% |
| Sep 2026 | $0.7650 | $0.7200 | $0.8200 | +7.20% |
| Oct 2026 | $0.7800 | $0.7300 | $0.8500 | +9.30% |
| Nov 2026 | $0.8000 | $0.7500 | $0.8700 | +12.10% |
| Dec 2026 | $0.8200 | $0.7600 | $0.9000 | +14.90% |
Re’s 2026 price range is projected at $0.6800-$0.9000, based on current technical structure and momentum trends visible on the chart. The 200-day MA at $0.7364 remains the key bull/bear line — a hold above this level could target $0.7800-$0.9000, while a breakdown below the $0.6800 support zone may increase downside risk toward $0.6500. The MACD remains negative but is improving, while RSI at 43.79 indicates the asset is not in overbought conditions.
Re Price Prediction 2026 to 2040 (Long Term)
| Year | Price Target | Support | Resistance | ROI |
| 2027 | $0.9500 | $0.8000 | $1.1000 | +33.00% |
| 2028 | $1.2000 | $1.0000 | $1.4500 | +68.00% |
| 2029 | $1.5000 | $1.2000 | $1.8000 | +110.00% |
| 2030 | $1.8500 | $1.5000 | $2.2000 | +159.00% |
| 2031 | $2.0000 | $1.6500 | $2.5000 | +180.00% |
| 2035 | $2.8000 | $2.2000 | $3.5000 | +292.00% |
| 2040 | $4.0000 | $3.0000 | $5.0000 | +460.00% |
Re 2030 Forecast: What Is the Expected Price?
Re price prediction 2030 targets $1.8500, within a range of $1.5000-$2.2000, based on long-term market expansion and possible demand growth. Continued ecosystem development and increasing adoption could influence future price movement. Technical recovery above major moving averages would remain important for sustained upside. Long-term valuation models suggest a wide range of possibilities depending on market cycles and overall crypto conditions.
Re 2031 Outlook and Expected Price Range
The Re price outlook for 2031 targets $2.0000, with a range of $1.6500-$2.5000, as the market enters a longer-term growth phase. Cycle analysis suggests 2031 may reflect either consolidation after previous highs or the beginning of a new accumulation period. Long-term holder activity and liquidity trends will remain key factors affecting price direction.
Re 2040 Long-Term Forecast
By 2040, Re price forecast projects a target of $4.0000, ranging from $3.0000 to $5.0000, depending on adoption, market demand, and overall crypto market maturity. Long-term projections remain highly uncertain and should be considered scenario-based estimates rather than fixed targets.
Re Technical Analysis
The following technical indicators were used to derive the price predictions above. Each indicator’s value and signal should be updated at the time of publishing.
| Indicator | Value | Signal |
| Relative Strength Index (14-Day RSI) | 43.79 | Neutral |
| 50-Day Moving Average | $0.7162 | Bearish |
| 200-Day Moving Average | $0.7364 | Bearish |
| MACD | -0.0040 | Bearish |
| MACD Histogram | -0.0059 | Negative |
| Average Trading Volume (24H) | $2.73M | Increasing |
Relative Strength Index (RSI)
The 14-day RSI is at 43.79, signaling neutral (30-70) conditions. The current RSI suggests that RE is neither overbought nor oversold. The market is showing indecision, and the next directional move may depend on whether buyers can push price above nearby resistance levels.
Moving Averages (50-Day & 200-Day MA)
RE is below its 50-day MA at $0.7162 and below its 200-day MA at $0.7364. This indicates short-term weakness within a broader downtrend structure. The $0.7364 level acts as a key resistance zone, and a breakout above this area could improve bullish momentum.
MACD (Moving Average Convergence Divergence)
The MACD is below the signal line with a histogram value of -0.0059, indicating bearish momentum. The negative histogram shows selling pressure is still present, although the MACD curve is attempting to recover from lower levels.
Volume Analysis
Re’s average trading volume shown on the chart is approximately $2.73M (24H). Volume activity has increased, supporting higher market participation. However, stronger buying volume would be required to confirm a sustained bullish reversal.
Disclaimer: This article is for informational purposes only and does not constitute financial or investment advice. Crypto markets are highly volatile. Always do your own research (DYOR) before making any investment decisions.

