


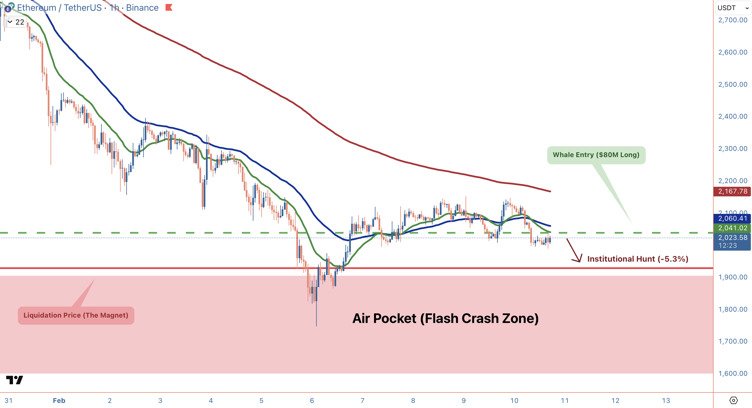
An Ethereum whale has opened an $80 million ETH long position using 20x leverage, drawing sharp attention across derivatives markets as liquidation risk builds near the $1,930 level. ETH is currently trading around $1,946, down roughly 14% over the past week, placing the heavily leveraged position within striking distance of forced closure.
The whale entered the trade near $2,039, meaning only a modest downside move could trigger liquidation. With ETH trading below key resistance levels and volatility elevated, the setup has sparked renewed discussion around potential liquidation cascades and liquidity-driven price swings.
High Leverage Meets Weak Technical Structure
A 20x leveraged position can withstand only a very small adverse price move before getting liquidated. Here, a fall of just about 5% would be enough to set off an automatic closure. That level is quite close to a clearly visible support zone near $1,930.
The recent pattern on the chart illustrates Ethereum losing the battle to regain the resistance level from above. The longer-term trend on the daily chart is still showing signs of weakness as lower highs are being made under a falling red trendline. Unless ETH manages to close above this price level with strong involvement from the spot market, the upside move is not yet confirmed.
This technical weakness creates a fragile backdrop for aggressive long exposure. When large positions become visible in such conditions, they naturally attract liquidity-driven reactions.
Source: TradingView
Read more: Ethereum Price Prediction
Liquidity Zones and the $1,800 Level
The liquidation price near $1,930 aligns with what traders describe as a liquidity cluster. If price breaks below that level, forced selling can intensify downward momentum. The highlighted air pocket (flash crash zone) on the chart marks an area with limited historical consolidation, where price can move quickly due to thin resting bids.
On the daily timeframe, ETHUSDT recently rejected a green resistance zone and moved sharply lower. The yellow horizontal level near $1,761 represents a prior demand area. A decisive break below $1,930 could open the path toward $1,800 and potentially test deeper supports.
Exchange inflows of ETH have also increased, signaling potential spot supply. While exchange deposits alone do not confirm selling, they often precede higher volatility during leveraged conditions.
The link between high leverage and thin liquidity remains critical. When volatility expands, liquidation mechanics accelerate moves rather than stabilize them.
Trade ETH in INR on ![]()
Deposit and withdraw in INR (₹).
No Conversion to Crypto Required.

Market Context and Risk Framework
Funding rates have fluctuated, reflecting unstable positioning across derivatives platforms. Elevated leverage combined with visible liquidation levels tends to compress price action around key zones before expansion occurs.
Professional risk management typically adjusts leverage downward when price trades below major resistance. In the current structure, ETH remains capped under $2,200. Support at $1,930 and $1,800 now defines the short-term battlefield.
This is not a narrative-driven event. It is a structural setup shaped by leverage, liquidity, and technical positioning. Whether Ethereum stabilizes above support or accelerates lower depends on how price behaves around these levels.
Conclusion
The $80 million 20x leveraged ETH long highlights the risks present in a technically weak and liquidity-sensitive market. With Ethereum trading below resistance and near key support, even modest volatility can trigger liquidation cascades. Until ETH reclaims higher levels with confirmed volume, capital preservation and controlled exposure remain essential.

