

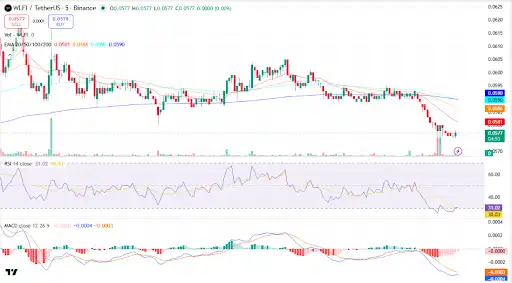
World Liberty Financial (WLFI) is currently trading at $0.05757, reflecting a bearish market sentiment as of 11 June 2026. The 14-day RSI stands at 31.02, signaling near-oversold conditions, while the 50-day and 200-day moving averages are positioned at $0.0586 and $0.0590, respectively. The MACD is negative, indicating bearish short-term momentum. Based on these technical indicators and broader market trends, WLFI is expected to remain under pressure and consolidate between support at $0.0570 and resistance near $0.0581 in the near term.
Key Insights
- Short term: WLFI remains below all major EMAs, suggesting weakness this week and limited upside unless $0.0581 is reclaimed.
- Monthly outlook: A recovery above $0.0590 could improve sentiment through June–July 2026, while failure to hold $0.0570 may extend losses.
- Technical analysis: RSI at 31.02 is approaching oversold territory, but MACD remains negative, keeping momentum bearish despite a minor rebound.
World Liberty Financial Short-Term Price Prediction – Today, This Week, June 2026
Here is the WLFI coin price prediction 2026 for today, this week, and June 2026.
| Timeframe | Price Target | Support | Resistance | ROI |
| Next 24 Hrs | $0.0578 | $0.0570 | $0.0581 | +0.40% |
| This Week | $0.0585 | $0.0570 | $0.0590 | +1.62% |
| June 2026 | $0.0590 | $0.0570 | $0.0600 | +2.48% |
World Liberty Financial Price Prediction Today
World Liberty Financial is trading at $0.05757 and is expected to range between $0.0570 and $0.0581 in the next 24 hours. The RSI sits at 31.02 and the 20-EMA at $0.0581 signals bearish short-term momentum. A hold above $0.0570 targets $0.0581; a break below risks a drop to $0.0570.
World Liberty Financial Price Prediction for This Week
World Liberty Financial is projected to trade between $0.0570 and $0.0590 for the week of June 11–17, 2026. WLFI is below the 50-day EMA at $0.0586, with the MACD histogram expanding on the negative side, pointing to bearish momentum. A weekly close above $0.0590 opens $0.0600; a loss of $0.0570 targets $0.0560.
World Liberty Financial Crypto Price Prediction for June 2026
World Liberty Financial’s June 2026 price prediction targets $0.0590, with a range of $0.0570–$0.0600. WLFI is below its 200-day MA at $0.0590, and the monthly RSI at 31.02 signals oversold conditions. A monthly close above $0.0600 would confirm bullish momentum heading into Q2 2026.
World Liberty Financial Crypto Price Prediction for July 2026
World Liberty Financial’s July 2026 price prediction targets $0.0600, with a range of $0.0580–$0.0610. WLFI is below its 200-day MA at $0.0590, and the monthly RSI at 31.02 signals oversold conditions. A monthly close above $0.0600 would confirm bullish momentum heading into Q3 2026.
World Liberty Financial Token Price Prediction 2026 (Medium Term)
| Month | Price Target | Support | Resistance | ROI |
| June 2026 | $0.0590 | $0.0570 | $0.0600 | +2.48% |
| July 2026 | $0.0600 | $0.0580 | $0.0610 | +4.22% |
| Aug 2026 | $0.0605 | $0.0585 | $0.0615 | +5.09% |
| Sep 2026 | $0.0610 | $0.0590 | $0.0620 | +5.96% |
| Oct 2026 | $0.0615 | $0.0595 | $0.0625 | +6.82% |
| Nov 2026 | $0.0620 | $0.0600 | $0.0630 | +7.69% |
| Dec 2026 | $0.0625 | $0.0605 | $0.0635 | +8.56% |
World Liberty Financial’s 2026 price range is projected at $0.0570–$0.0635, driven by technical recovery from current support levels. The 200-day MA at $0.0590 is the key bull/bear line — a hold above targets $0.0635, while a break below $0.0570 risks a drop to $0.0560. Weekly MACD is negative and RSI is trending below the midline.
World Liberty Financial Price Prediction 2026 to 2040 (Long Term)
| Year | Price Target | Support | Resistance | ROI |
| 2027 | $0.0650 | $0.0600 | $0.0700 | +12.92% |
| 2028 | $0.0720 | $0.0650 | $0.0780 | +25.07% |
| 2029 | $0.0800 | $0.0720 | $0.0880 | +38.97% |
| 2030 | $0.0900 | $0.0800 | $0.1000 | +56.34% |
| 2031 | $0.0950 | $0.0850 | $0.1050 | +65.03% |
| 2035 | $0.1200 | $0.1050 | $0.1350 | +108.45% |
| 2040 | $0.1600 | $0.1400 | $0.1800 | +177.95% |
Also Read: How to Buy World Liberty Financial Coin
World Liberty Financial 2030 Forecast: What Is the Expected Price?
World Liberty Financial price prediction 2030 targets $0.0900, within a range of $0.0800–$0.1000, supported by long-term recovery from current trading levels and sustained network growth. Based on the current chart structure, the asset remains below major moving averages but could gradually appreciate if key resistance zones are reclaimed. Technical trend projections support a range of $0.0800–$0.1000 under continued market expansion.
World Liberty Financial 2031 Outlook and Expected Price Range
The World Liberty Financial price outlook for 2031 targets $0.0950, with a range of $0.0850–$0.1050, as the market transitions from a recovery phase into broader trend confirmation. Cycle analysis suggests 2031 could mirror the 2026 pattern—either consolidating after a prior advance or establishing a new support base. Momentum indicators and long-term moving averages will remain key signals to monitor.
World Liberty Financial 2040 Long-Term Forecast
By 2040, the World Liberty Financial price forecast is projected at $0.1600, ranging from $0.1400 to $0.1800. Based on the current technical structure, a gradual appreciation trajectory remains possible if adoption and liquidity continue improving. Long-term trend-extension models point to $0.1400–$0.1800 under moderate growth scenarios, while aggressive bullish conditions could push prices above $0.2000. These forecasts carry high uncertainty and should be viewed as scenario ranges rather than fixed outcomes.
World Liberty Financial Technical Analysis
The following technical indicators were used to derive the price predictions above. Each indicator’s value and signal should be updated at the time of publishing.
| Indicator | Value | Signal |
| Relative Strength Index (14-Day RSI) | 31.02 | Neutral |
| 50-Day Moving Average | $0.0586 | Bearish |
| 200-Day Moving Average | $0.0590 | Bearish |
| MACD | -0.0004 | Bearish |
| MACD Histogram | -0.0003 | Negative |
| Average Trading Volume (14-Day) | Increasing | Increasing |
Relative Strength Index (RSI)
The 14-day RSI is at 31.02, signaling neutral (30–70) conditions, although it is approaching oversold territory. The indicator suggests weak momentum and market indecision. A move below 30 could trigger a relief rally, while a recovery above 40 would indicate improving buyer strength.
Moving Averages (50-Day & 200-Day MA)
WLFI is below its 50-day MA at $0.0586 and below its 200-day MA at $0.0590. This alignment reflects a sustained downtrend, with both moving averages acting as immediate resistance zones. A break above the 200-day MA would be required to shift the broader outlook toward bullish territory.
MACD (Moving Average Convergence Divergence)
The MACD is below the signal line with a histogram of -0.0003, indicating bearish momentum. The bearish crossover remains intact, and the expanding negative histogram suggests sellers continue to control short-term price action. Momentum will remain weak until the MACD begins converging toward the signal line.
Volume Analysis
World Liberty Financial’s average daily trading volume over the past 14 days appears to be increasing, supported by the recent spike in activity visible on the chart. Rising volume confirms bearish conviction behind the recent decline and suggests traders remain active around the $0.0570 support zone.Disclaimer: This article is for informational purposes only and does not constitute financial or investment advice. Crypto markets are highly volatile. Always do your own research (DYOR) before making any investment decisions.


