This Jupiter crypto price prediction analyses JUP’s short-, medium-, and long-term outlook using technical indicators such as RSI, MACD, moving averages, and price action. It covers forecasts for today, this week, August 2026, and yearly projections through 2040. The analysis also highlights important support and resistance levels, helping readers understand potential market trends and price movements based on the latest TradingView chart data.
Jupiter (JUP) is currently trading at $0.1953, reflecting a neutral market sentiment as of 30 July 2026. The 14-day RSI stands at 42.89, signaling neutral conditions, while the 50-day and 200-day moving averages are positioned at $0.1961 and $0.1957, respectively. The MACD is negative, indicating bearish short-term momentum. Based on these technical indicators and broader market trends, JUP is expected to consolidate between $0.1950 and $0.1965 in the near term unless a decisive breakout occurs.
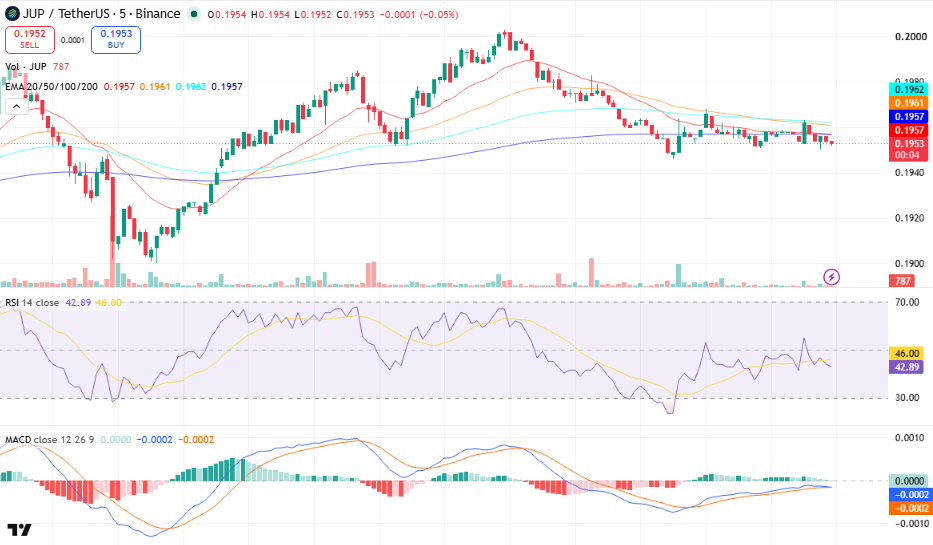
JUP/USDT, Source TradingView
Key Insights
- Short-term outlook: JUP may remain range-bound this week between $0.1950 and $0.1965, with buyers needing a close above resistance to regain momentum. August 2026 could see gradual recovery if broader market sentiment improves.
- Long-term outlook: During 2026, JUP may trade in a moderate recovery range, while 2030 depends on ecosystem growth and overall crypto market conditions rather than current technicals.
- Technical analysis: RSI remains below the 50 mark, price is trading below the 20/50/100 EMAs, and the MACD remains slightly negative, indicating weak momentum despite support holding near the 200-day MA.
Jupiter Short-Term Price Prediction – Today, This Week, August 2026
Here is the Jupiter price prediction 2026 for today, this week, and August 2026.
| Timeframe | Price Target | Support | Resistance | ROI |
| Next 24 Hrs | $0.1960 | $0.1950 | $0.1962 | +0.36% |
| This Week | $0.1965 | $0.1945 | $0.1970 | +0.61% |
| August 2026 | $0.2000 | $0.1920 | $0.2000 | +2.41% |
Jupiter Price Prediction Today
Jupiter is trading at $0.1953 and is expected to range between $0.1950 and $0.1962 in the next 24 hours. The RSI sits at 42.89 and the 20-EMA at $0.1957 signals bearish short-term momentum. A hold above $0.1950 targets $0.1962; a break below risks a drop to $0.1940.
JUP Coin Price Prediction for This Week
Jupiter is projected to trade between $0.1945 and $0.1970 for the week of 30 July-5 August 2026. JUP is below the 50-day EMA at $0.1961, with the MACD histogram contracting, pointing to bearish momentum. A weekly close above $0.1970 opens $0.2000; a loss of $0.1945 targets $0.1930.
Jupiter Price Prediction for August 2026
Jupiter (JUP) is projected to trade around $0.2000 in August 2026, with expected price fluctuations between $0.1920 and $0.2000. The token is currently trading below its 200-day moving average of $0.1957, indicating the broader market trend remains cautious. Meanwhile, the monthly RSI stands at 42.89, reflecting neutral momentum. If JUP successfully breaks and holds above the $0.2000 resistance level, it could strengthen the bullish outlook for the months ahead.
JUP Coin Price Prediction for September 2026
For September 2026, Jupiter is forecast to reach an average price of $0.2050, while trading within a projected range of $0.1970 to $0.2100. Technical indicators suggest that JUP remains below its 200-day moving average at $0.1957, highlighting its long-term trend. At the same time, a monthly RSI reading of 42.89 points to neutral market conditions. Sustained buying pressure above $0.2000 may pave the way for further upside and reinforce investor confidence during the following months.
Jupiter Price Prediction 2026 (Medium Term)
| Month | Price Target | Support | Resistance | ROI |
| Aug 2026 | $0.2000 | $0.1920 | $0.2000 | +2.41% |
| Sep 2026 | $0.2050 | $0.1970 | $0.2100 | +4.97% |
| Oct 2026 | $0.2120 | $0.2020 | $0.2180 | +8.55% |
| Nov 2026 | $0.2200 | $0.2100 | $0.2280 | +12.65% |
| Dec 2026 | $0.2300 | $0.2200 | $0.2400 | +17.77% |
Jupiter’s 2026 price range is projected at $0.1920-$0.2300, driven by post-halving supply dynamics and ETF inflows. The 200-day MA at $0.1957 is the key bull/bear line—a hold above targets $0.2300, while a break below $0.1920 risks a drop to $0.1880. Weekly MACD is negative and RSI is trending below the midline.
JUP Coin Price Prediction 2026 to 2040 (Long Term)
| Year | Price Target | Support | Resistance | ROI |
| 2027 | $0.2600 | $0.2200 | $0.2800 | +33.13% |
| 2028 | $0.3400 | $0.2800 | $0.3700 | +74.09% |
| 2029 | $0.4300 | $0.3600 | $0.4700 | +120.17% |
| 2030 | $0.5500 | $0.4600 | $0.6000 | +181.62% |
| 2031 | $0.6200 | $0.5200 | $0.6800 | +217.46% |
| 2035 | $1.0000 | $0.8500 | $1.1500 | +412.04% |
| 2040 | $1.8000 | $1.5000 | $2.1000 | +821.76% |
Jupiter 2030 Forecast: What Is the Expected Price?
JUP Coin price prediction 2030 targets $0.5500, within a range of $0.4600-$0.6000, supported by continued ecosystem expansion and broader crypto market adoption. Based on the current technical structure, a sustained recovery above long-term resistance levels could improve the long-term outlook. Under moderate growth assumptions, longer-term valuation models support a range of $0.4500-$0.6500 if network activity and liquidity continue to expand.
Jupiter 2031 Outlook and Expected Price Range
The Jupiter price outlook for 2031 targets $0.6200, with a range of $0.5200-$0.6800. Market cycles suggest 2031 could represent a consolidation phase following the gains anticipated during 2030. Long-term accumulation trends, exchange balances, and ecosystem adoption are expected to remain the primary indicators influencing price direction.
Jupiter price prediction 2040: Long-Term Forecast
The Jupiter price forecast for 2040 projects an average price of $1.8000, ranging from $1.5000 to $2.1000 under moderate adoption assumptions. Continued protocol development, sustained user growth, and broader digital asset adoption could support higher valuations over the long term. These projections represent scenario-based estimates and carry considerable uncertainty.
Jupiter Technical Analysis
The following technical indicators were used to derive the price predictions above. Each indicator’s value and signal should be updated at the time of publishing.
| Indicator | Value | Signal |
| Relative Strength Index (14-Day RSI) | 42.89 | Neutral |
| 50-Day Moving Average | $0.1961 | Bearish |
| 200-Day Moving Average | $0.1957 | Bearish |
| MACD | -0.0002 | Bearish |
| MACD Histogram | -0.0002 | Negative |
| Average Trading Volume (14-Day) | 787 JUP | Decreasing |
Relative Strength Index (RSI)
The 14-day RSI is at 42.89, signaling neutral (30-70) conditions. Momentum remains balanced but slightly tilted toward sellers, suggesting indecision. The next significant price catalyst is likely to determine whether JUP breaks higher or extends its consolidation.
Moving Averages (50-Day & 200-Day MA)
JUP is below its 50-day MA at $0.1961 and below its 200-day MA at $0.1957. This reflects a Death Cross-style technical structure, indicating that the broader trend remains weak while both moving averages continue to act as immediate resistance.
MACD (Moving Average Convergence Divergence)
The MACD is below the signal line with a histogram of -0.0002, indicating bearish momentum. The histogram is relatively flat, suggesting selling pressure is easing and a directional breakout could develop over the next several sessions.
Volume Analysis
Jupiter’s average daily trading volume over the past 14 days is approximately 787 JUP. Declining volume indicates weakening market conviction, making continued consolidation more likely until stronger buying or selling activity emerges.
Disclaimer: This article is for informational purposes only and does not constitute financial or investment advice. Crypto markets are highly volatile. Always do your own research (DYOR) before making any investment decisions.