Trade INJ in Futures Market at CoinDCX
Issued on: 17th Aug’23
Valid upto: 27th Aug’23
Category: Layer-1 Blockchain
Market Cap: $603,928,677
Price Update:
INJ price at the time of writing (17th Aug’23, 15:05) is $7.21, with a 24-hour trading volume increased by 61.47% to $57,866,087. INJ price is up by 1.26% in the last 24 hours according to coinmarketcap.com.
Source: TradingView
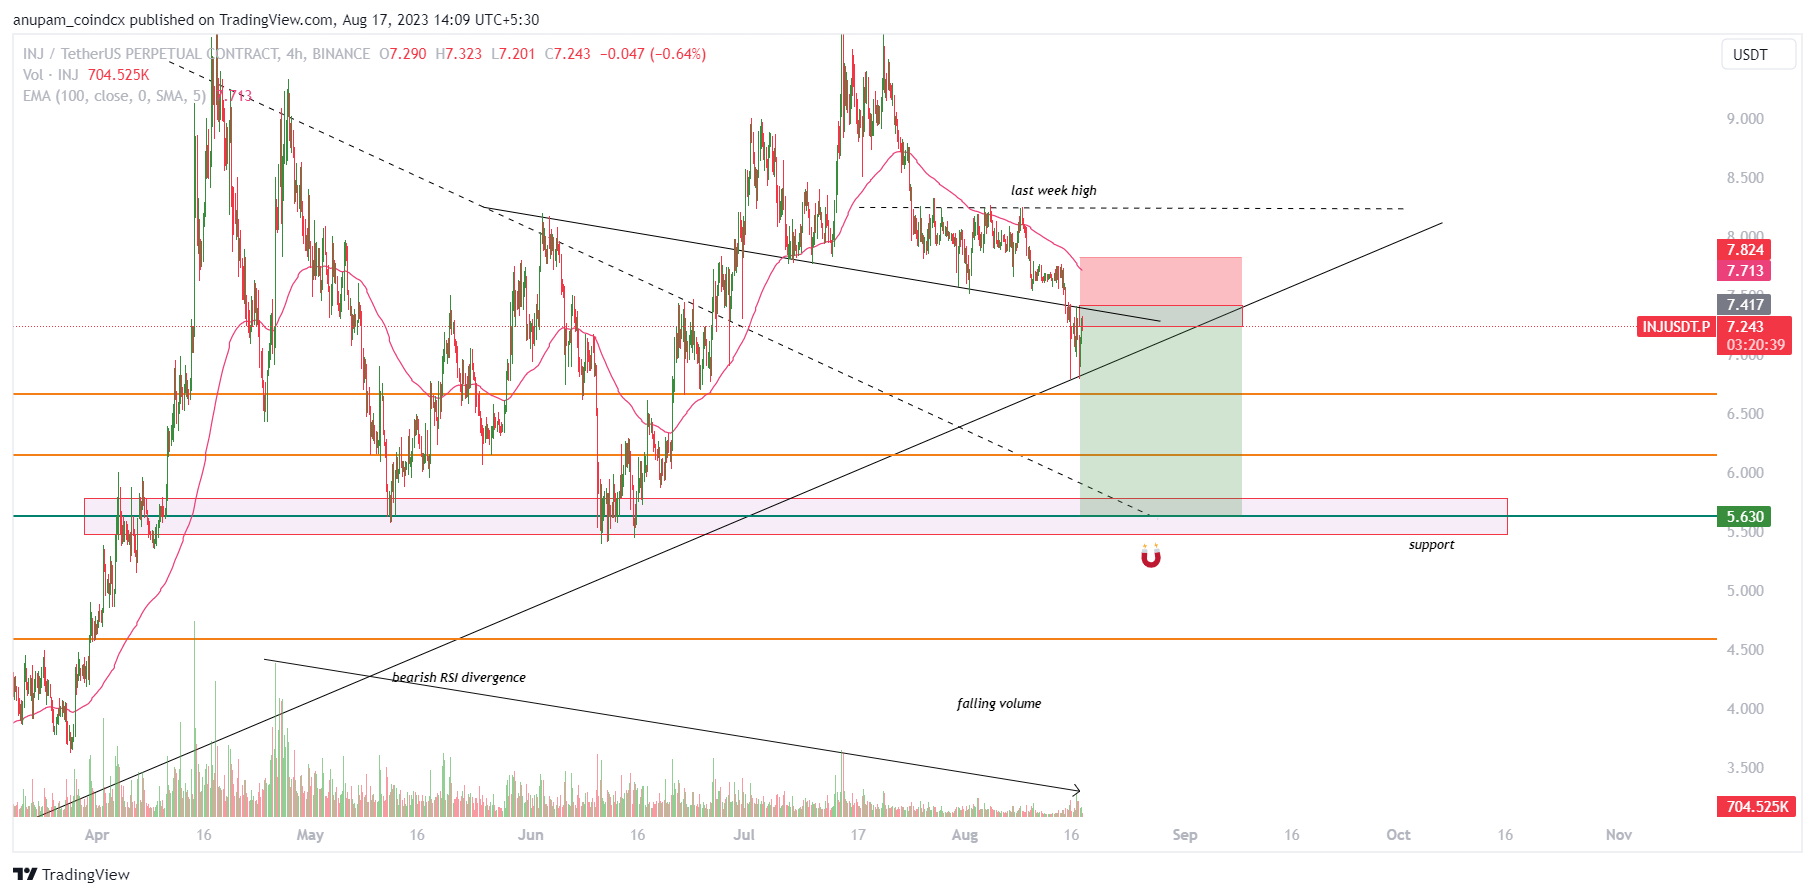
Analyzing the above chart:
- The latest monthly candle closure of INJ USDT indicates a strong rejection from higher levels, implying a bearish sentiment.
- The broader market is also exhibiting a bearish trend at the moment.
- In the 1-day timeframe, INJ displays a bearish RSI divergence, further suggesting potential downside movement.
- There’s a consistent decrease in trading volume even as the price of INJ rises, indicating weakening bullish momentum and the possibility of a decline.
- The presence of fakeouts in smaller timeframes adds to the confirmation of the bearish sentiment.
- Moreover, INJ is currently trading below its 100-day and 50-day Exponential Moving Averages (EMAs), reinforcing the bearish outlook.
- Bottom support levels: $6.819 (demand zone),$6.147 & $5.630(major)
- Upper resistance level: $8.247 ( last week high)
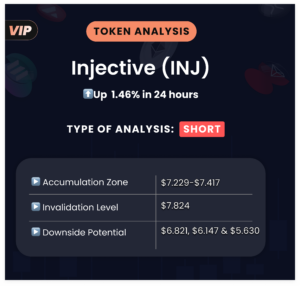
- A Short Trading strategy can be assessed between $7.229-$7.417 with an invalidation above $7.824
- On the downside, one can see a fall of 20-25% toward $6.821, $6.147 & $5.630(valid for 10 days)
- It would seem that one should maintain a balanced risk-to-reward ratio and check the use of leverage and position size to ride out current market conditions.
Note: INJ is now available in the futures market in both Go and Pro apps with up to 15x leverage.
LAST 30 DAYS ANALYSIS SUMMARY:
| DATE | TOKEN | Strategy (Long/Short) |
TOKEN RETURN% | TOKEN RETURN % (with 8x leverage) |
BTC RETURN% |
| 20-July | STX | Long | -3.62% | -28.98% | -4.36% |
| 21-July | SAND | Short | 4.57% | 36.55% | -0.95% |
| 25-July | DOGE | Long | 6.97% | 55.76% | 0.95% |
| 26-July | WLD | Short | 7.60% | 60.81% | 0.95% |
| 28-July | ETH | Short | 2.53% | 20.27% | 0.36% |
| 1-August | OP | Short | -5.33% | -42.64% | 0.43% |
| 3-August | BCH | Short | 6.39% | 51.12% | -0.52% |
| 4-August | FLOW | Short | 6.16% | 49.28% | -1.90% |
| 4-August | 1000SHIB | Long | 26.16% | 209.30% | 1.41% |
| 7-August | MAGIC | Long | -2.59% | -20.75% | -1.69% |
| 8-August | ADA | Short | 11.27% | 90.19% | -4.27% |
| 11-August | AAVE | Short | 11.53% | 92.22% | -4.15% |
| AVERAGE RETURN | 5.97% | 47.8% | -1.15% | ||
| SUCCESS RATE | 75% |
Return % is calculated based on pricing data as available on the platform and is valid for 15 days from the date of publishing.
Disclaimer: “The information, advise and/or views provided on this page are that of the author or company and are for informational purposes only. The Platform does not intend to: (i) an offer, or solicitation of an offer, to invest in, or to buy or sell, any interests or shares, or to participate in any investment or trading strategy, or (ii) to provide accounting, legal, or tax advice, or investment recommendations, or (iii) make any representation of any kind, express or implied, on accuracy, availability, reliability or completeness of the same. Note Crypto products and NFTs are unregulated and can be highly risky. There may be no regulatory recourse for any loss from such transactions. AT NO TIME WILL THE PLATFORM BE LIABLE FOR YOUR USE OR RELIANCE OF THE SAID INFORMATION, ADVISE AND/OR VIEW WHICH IS SOLELY AT YOUR OWN RISK.”