

The SPX6900 future price prediction analyzes the token’s outlook from 2026 to 2040 using technical indicators, including RSI, MACD, and moving averages. It covers daily, weekly, monthly, and long-term price targets, along with key support and resistance levels derived from the latest chart data. The analysis also highlights market momentum, trend strength, and potential price scenarios to help readers understand SPX6900’s evolving technical outlook.
SPX6900 (SPX) is currently trading at $0.48186703, reflecting a bullish market sentiment as of the chart provided. The 14-day RSI stands at 61.90, signaling neutral conditions, while the 50-day and 200-day moving averages are positioned at $0.45209409 and $0.41176605, respectively. The MACD is positive, indicating bullish short-term momentum despite the histogram turning slightly negative. Based on these technical indicators and broader market trends, SPX is expected to test resistance near $0.49000000 while remaining supported above $0.47289204 in the near term.
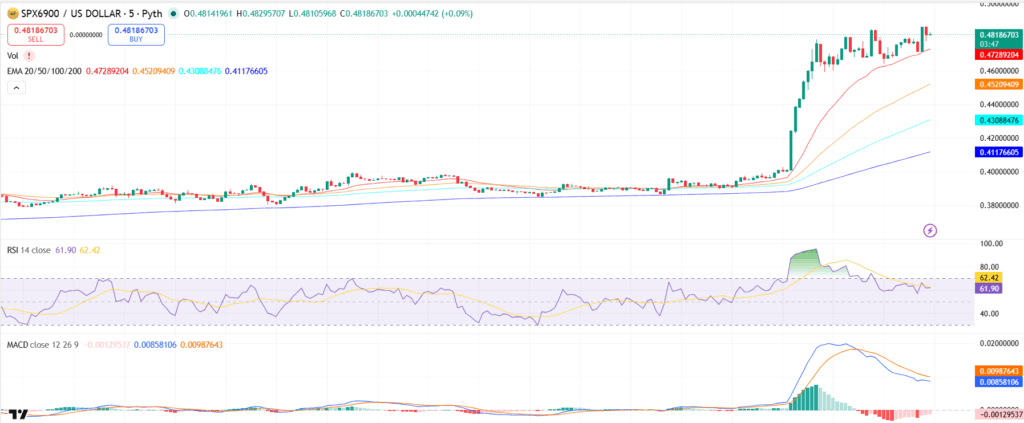
SPX6900/USD, Source TradingView
Key Insights
- Short term (Week & Month): SPX remains above all major moving averages, suggesting the trend remains positive as long as support around the 20-EMA holds.
- 2026 & 2030: The long-term structure remains constructive while price trades above the 200-day MA, though future performance will depend on broader market conditions.
- Current Technical Analysis: RSI is neutral at 61.90, while price trades above the 20/50/100/200 EMAs. MACD remains above zero but weakening, suggesting bullish momentum is slowing.
SPX6900 Short-Term Price Prediction – Today, This Week, June 2026
Here is the SPX6900 coin price prediction 2026 for today, this week, and June 2026.
| Timeframe | Price Target | Support | Resistance | ROI |
| Next 24 Hrs | $0.49000000 | $0.47289204 | $0.49000000 | +1.69% |
| This Week | $0.50000000 | $0.47289204 | $0.50000000 | +3.76% |
| June 2026 | $0.51000000 | $0.45209409 | $0.51000000 | +5.84% |
SPX6900 Price Prediction Today
SPX6900 is trading at $0.48186703 and is expected to range between $0.47289204 and $0.49000000 in the next 24 hours. The RSI sits at 61.90 and the 20-EMA at $0.47289204 signals bullish short-term momentum. A hold above $0.47289204 targets $0.49000000; a break below risks a drop to $0.45209409.
SPX6900 Price Prediction for This Week
SPX6900 is projected to trade between $0.47289204 and $0.50000000 for the week of the chart provided. SPX is above the 50-day EMA at $0.45209409, with the MACD histogram contracting, pointing to bullish momentum. A weekly close above $0.49000000 opens $0.50000000; a loss of $0.47289204 targets $0.45209409.
SPX6900 Price Prediction for June 2026
SPX6900’s June 2026 price prediction targets $0.51000000, with a range of $0.45209409-$0.51000000. SPX is above its 200-day MA at $0.41176605, and the monthly RSI at 61.90 signals neutral conditions. A monthly close above $0.50000000 would confirm bullish momentum heading into Q2 2026.
Trade SPX6900 in INR on ![]()
Deposit and withdraw in INR (₹).
No Conversion to Crypto Required.

SPX6900 Price Prediction for July 2026
SPX6900’s July 2026 price prediction targets $0.53000000, with a range of $0.47289204-$0.53000000. SPX is above its 200-day MA at $0.41176605, and the monthly RSI at 61.90 signals neutral conditions. A monthly close above $0.51000000 would confirm bullish momentum heading into Q3 2026.
SPX6900 Price Prediction 2026 (Medium Term)
| Month | Price Target | Support | Resistance | ROI |
| June 2026 | $0.51000000 | $0.45209409 | $0.51000000 | +5.84% |
| July 2026 | $0.53000000 | $0.47289204 | $0.53000000 | +9.99% |
| Aug 2026 | $0.54000000 | $0.47289204 | $0.54000000 | +12.07% |
| Sep 2026 | $0.55000000 | $0.45209409 | $0.55000000 | +14.14% |
| Oct 2026 | $0.56000000 | $0.45209409 | $0.56000000 | +16.22% |
| Nov 2026 | $0.57000000 | $0.45209409 | $0.57000000 | +18.29% |
| Dec 2026 | $0.58000000 | $0.45209409 | $0.58000000 | +20.37% |
SPX6900’s 2026 price range is projected at $0.45209409-$0.58000000. The 200-day MA at $0.41176605 is the key bull/bear line—a hold above targets $0.58000000, while a break below $0.41176605 risks a drop to $0.39000000. Weekly MACD is positive and RSI is trending above the midline.
SPX6900 Price Prediction 2026 to 2040 (Long Term)
| Year | Price Target | Support | Resistance | ROI |
| 2027 | $0.62000000 | $0.50000000 | $0.62000000 | +28.67% |
| 2028 | $0.70000000 | $0.56000000 | $0.70000000 | +45.27% |
| 2029 | $0.78000000 | $0.62000000 | $0.78000000 | +61.87% |
| 2030 | $0.90000000 | $0.70000000 | $0.90000000 | +86.78% |
| 2031 | $0.98000000 | $0.78000000 | $0.98000000 | +103.38% |
| 2035 | $1.25000000 | $1.00000000 | $1.25000000 | +159.41% |
| 2040 | $1.80000000 | $1.40000000 | $1.80000000 | +273.56% |
SPX6900 2030 Forecast: What Is the Expected Price?
SPX6900 price prediction 2030 targets $0.90000000, within a range of $0.70000000-$0.90000000. Based on the chart, SPX remains above its major moving averages, supporting a constructive long-term trend if this structure is maintained. Technical strength currently favors continuation while price remains above the 200-day moving average.
SPX6900 2031 Outlook and Expected Price Range
The SPX6900 price outlook for 2031 targets $0.98000000, with a range of $0.78000000-$0.98000000. Based on the current technical structure, price remains above all key moving averages, suggesting the broader trend stays positive while momentum is sustained. Cycle behavior may resemble the 2026 pattern of consolidation following a strong rally.
SPX6900 2040 Long-Term Forecast
The SPX6900 price forecast for 2040 projects an average price of $1.80000000, ranging from $1.40000000 to $1.80000000. The current long-term trend remains constructive as price trades above the 200-day moving average. These projections represent scenario ranges derived from the present technical structure and carry significant uncertainty over such long time horizons.
SPX6900 Technical Analysis
The following technical indicators were used to derive the price predictions above. Each indicator’s value and signal should be updated at the time of publishing.
| Indicator | Value | Signal |
| Relative Strength Index (14-Day RSI) | 61.90 | Neutral |
| 50-Day Moving Average | $0.45209409 | Bullish |
| 200-Day Moving Average | $0.41176605 | Bullish |
| MACD | 0.00858106 | Bullish |
| MACD Histogram | -0.00129537 | Negative |
| Average Trading Volume (24h) | $116.59M | Increasing |
Relative Strength Index (RSI)
The 14-day RSI is at 61.90, signaling neutral (30-70) conditions. Momentum remains positive without entering overbought territory, suggesting price still has room to extend higher while remaining susceptible to short-term consolidation.
Moving Averages (50-Day & 200-Day MA)
SPX6900 is above its 50-day MA at $0.45209409 and above its 200-day MA at $0.41176605. This alignment indicates bullish macro momentum, with both moving averages acting as key support levels.
MACD (Moving Average Convergence Divergence)
The MACD is above the signal line with a histogram of -0.00129537, indicating bullish momentum, although the negative histogram suggests upside momentum is slowing and consolidation may occur before the next directional move.
Volume Analysis
SPX6900’s 24-hour trading volume is $116.59M. Increasing trading activity confirms strong market participation and supports the recent upward price trend.
Disclaimer: This article is for informational purposes only and does not constitute financial or investment advice. Crypto markets are highly volatile. Always do your own research (DYOR) before making any investment decisions.
Related Read: Top Meme Coins by Market Capitalization
FAQs
1. Does SPX6900 have a future?
SPX6900 is a meme coin, and like most meme tokens, its future depends heavily on community activity, market sentiment, and social media trends, not fundamentals. Meme coins can be extremely volatile, but if the hype cycle continues and liquidity grows, SPX6900 may maintain short-term momentum. As with all meme assets, investors should approach with caution and manage risk carefully.
2. How high can SPX6900 go?
There is no fixed price target for SPX6900 because meme coins move primarily on hype, narrative spikes, and liquidity inflows. If trading activity increases and the community stays active, SPX6900 may test new highs. However, meme tokens can also correct sharply, so price movements tend to be unpredictable and sentiment-driven.
3. Why is SPX6900 falling?
SPX6900 may be falling due to common market factors such as profit-booking, reduced social media hype, broader crypto market corrections, or declining liquidity. Meme coins often experience volatile price swings, especially when trends shift. Despite such corrections, some traders continue to track SPX6900 for short-term opportunities based on volume recovery and social sentiment.
4. How much is the SPX6900 meme coin worth?
SPX6900’s value fluctuates frequently based on market demand, trading volume, and exchange liquidity. You can check the latest SPX6900 price in real time on major crypto price-tracking websites or supported exchanges.
5. SPX6900 Price in INR
The INR value of SPX6900 changes based on USD trading pairs and market volatility. To see the latest SPX6900 price in INR, use a crypto price converter or view the token price on exchanges that support SPX6900 trading
6. Where is SPX6900 listed?
SPX6900 is listed on select crypto exchanges like CoinDCX that support emerging meme tokens. Availability may vary depending on region and liquidity. Always ensure you trade on a reliable platform with proper security measures.
7. How to buy SPX6900 in India?
You can buy SPX6900 in India by trading it on supported exchanges.
If you want a secure and seamless experience, you can trade SPX6900 on CoinDCX here:
https://coindcx.com/trade/SPXUSDT
8. Is it worth buying SPX6900?
Whether SPX6900 is worth buying depends on an investor's risk tolerance and investment horizon. SPX6900 is considered a high-risk, high-reward asset due to its meme coin nature and speculative trading activity. Investors should conduct thorough research and only invest funds they can afford to lose.
9. What is SPX6900 price prediction today
SPX6900's short-term price outlook depends on market momentum, Bitcoin's price action, and overall risk appetite in the crypto market. Traders typically monitor support and resistance levels, trading volume, and sentiment indicators before making short-term forecasts.
10. What is SPX6900 price prediction 2026?
Based on broader market cycles and adoption trends, SPX6900's price could experience significant volatility throughout 2026. A bullish crypto market may support higher valuations, while bearish conditions could limit upside potential. Investors should closely watch macroeconomic developments and meme coin trends.
11. What is SPX6900 price prediction for 2030?
By 2030, SPX6900's performance will likely depend on its ability to maintain community engagement and survive multiple market cycles. In an optimistic scenario, sustained adoption could support higher prices, while weaker demand may reduce long-term growth prospects.
12. What is SPX6900 price prediction for the bull run?
During a crypto bull run, meme coins like SPX6900 often outperform the broader market due to increased retail participation and speculative capital flows. If market sentiment remains positive, SPX6900 could benefit from stronger trading activity and renewed investor interest.
13. What is SPX6900 price prediction for 2027?
SPX6900's 2027 price outlook may be influenced by the crypto market cycle, regulatory developments, and overall investor sentiment. Continued ecosystem growth and active community participation could support long-term price appreciation.
14. SPX6900 price prediction Reddit discussions
Reddit communities frequently discuss SPX6900's potential upside, market narratives, and future price targets. However, investors should treat social media predictions cautiously, as they often reflect sentiment rather than fundamental analysis.


