


This ether.fi crypto price prediction analyses ETHFI’s potential price movement using RSI, MACD, moving averages, and market trends. Discover ETHFI forecasts for today, this week, August 2026, and long-term projections through 2040. The report covers key support and resistance levels, technical indicators, and possible price targets to help traders and investors understand ETHFI’s short-, medium-, and long-term market outlook amid evolving crypto market conditions.
ether.fi (ETHFI) is currently trading at $0.4079, reflecting a cautious market sentiment as of 30 July 2026. The 14-day RSI stands at 48.57, signalling neutral conditions with momentum fading after the mid-July rejection, while the 50-day and 200-day moving averages are positioned at $0.402 and $0.501, respectively. The MACD has crossed below its signal line, indicating bearish short-term momentum. Based on these technical indicators and broader market trends, ETHFI is expected to consolidate between $0.395 and $0.418 before attempting a move toward higher resistance levels.
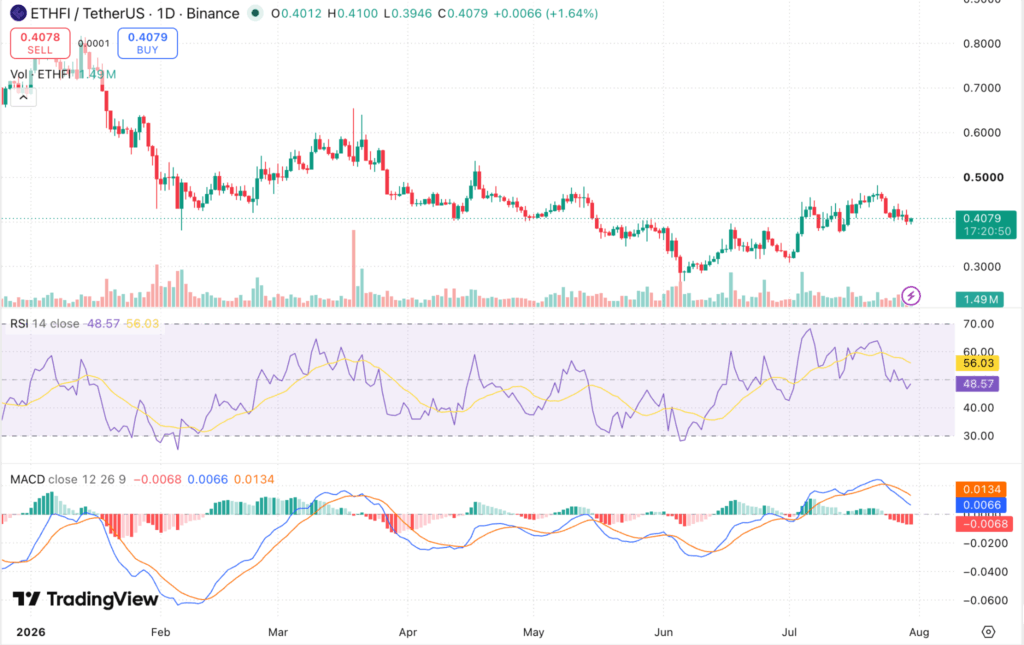
ether.fi/USDT, Source TradingView
Key Insights
- Short-term outlook: ETHFI may trade in the $0.395-$0.418 range this week, with buyers attempting to reclaim the $0.413 resistance zone.
- Medium-term outlook: If ETHFI holds above the 50-day MA near $0.402, the token could gradually move toward $0.465-$0.520 by the end of 2026.
- Long-term outlook: Continued ecosystem growth could support a move toward the $0.80-$1.10 region by 2030, although volatility is likely to remain elevated.
- Technical analysis: RSI has slipped back below the 50 midline and MACD has crossed lower, suggesting momentum is cooling after the July rally stalled near $0.49.
ether.fi Short-Term Price Prediction – Today, This Week, August 2026
Here is the ether.fi coin price prediction 2026 for today, this week, and August 2026.
| Timeframe | Price Target | Support | Resistance | ROI |
|---|---|---|---|---|
| Next 24 Hrs | $0.413 | $0.400 | $0.418 | +1.25% |
| This Week | $0.420 | $0.395 | $0.430 | +2.97% |
| August 2026 | $0.445 | $0.385 | $0.460 | +9.10% |
ether.fi Price Prediction Today
ether.fi is trading at $0.4079 and is expected to range between $0.400 and $0.418 in the next 24 hours. The RSI sits at 48.57 and the 20-EMA at $0.418 signals bearish short-term momentum. A hold above $0.400 targets $0.413; a break below risks a drop to $0.395.
Trade ETHFI in INR on 
Deposit and withdraw in INR (₹).
No Conversion to Crypto Required.

ether.fi Coin Price Prediction for This Week
ether.fi is projected to trade between $0.395 and $0.420 for the week of 30 July-5 August 2026. ETHFI is holding above the 50-day EMA at $0.402 but sits below the 100-day EMA at $0.413, with the MACD histogram turning negative, pointing to bearish momentum. A weekly close above $0.430 opens $0.445; a loss of $0.395 targets $0.385.
ether.fi Price Prediction for August 2026
ether.fi’s August 2026 price prediction targets $0.445, with a range of $0.385-$0.460. ETHFI is below its 200-day MA at $0.501, and the monthly RSI at 48.57 signals neutral conditions. A monthly close above $0.460 would confirm bullish momentum heading into September 2026.
ether.fi Coin Price Prediction for September 2026
ether.fi’s September 2026 price prediction targets $0.465, with a range of $0.400-$0.480. ETHFI is below its 200-day MA at $0.501, and the monthly RSI at 48.57 signals neutral conditions. A monthly close above $0.480 would confirm bullish momentum heading into Q4 2026.
ether.fi Price Prediction 2026 (Medium Term)
| Month | Price Target | Support | Resistance | ROI |
|---|---|---|---|---|
| Aug 2026 | $0.445 | $0.385 | $0.460 | +9.10% |
| Sep 2026 | $0.465 | $0.400 | $0.480 | +14.00% |
| Oct 2026 | $0.485 | $0.415 | $0.505 | +18.90% |
| Nov 2026 | $0.500 | $0.430 | $0.520 | +22.58% |
| Dec 2026 | $0.520 | $0.445 | $0.545 | +27.48% |
ether.fi’s 2026 price range is projected at $0.385-$0.545, driven by improving market conditions and broader crypto market strength. The 100-day MA at $0.413 is the near-term bull/bear line, a reclaim targets $0.545, while a break below $0.385 risks a drop to $0.340. Weekly MACD has crossed below its signal line and RSI is trending below the midline.
ether.fi Price Prediction 2026 to 2040 (Long Term)
| Year | Price Target | Support | Resistance | ROI |
|---|---|---|---|---|
| 2027 | $0.600 | $0.500 | $0.650 | +47.09% |
| 2028 | $0.720 | $0.580 | $0.800 | +76.51% |
| 2029 | $0.850 | $0.700 | $0.950 | +108.38% |
| 2030 | $0.950 | $0.800 | $1.100 | +132.90% |
| 2031 | $0.900 | $0.750 | $1.000 | +120.64% |
| 2035 | $1.300 | $1.000 | $1.500 | +218.71% |
| 2040 | $1.800 | $1.400 | $2.200 | +341.28% |
ether.fi 2030 Forecast: What Is the Expected Price?
The ether.fi price prediction 2030 targets $0.950, within a range of $0.800-$1.100, fuelled by the 2028 halving supply shock and growing institutional adoption. With broader crypto market maturity by then, scarcity and ecosystem expansion could become key price drivers. Stock-to-Flow and Power Law models support a range of $0.800-$1.100 under continued network growth.
ether.fi 2031 Outlook and Expected Price Range
The ether.fi price outlook for 2031 targets $0.900, with a range of $0.750-$1.000, as the market enters the post-cycle digestion phase. Cycle analysis suggests 2031 may mirror the 2026 pattern, either consolidating from a prior peak or building a new base. Long-term holder supply and exchange reserve trends will be the key on-chain signals to monitor.
ether.fi price prediction 2040: Long-Term Forecast
The ether.fi price forecast for 2040 projects a price target of $1.800, ranging from $1.400 to $2.200. Metcalfe’s Law and Power Law models point to a range of $1.400-$2.200 under moderate adoption, while aggressive scenarios could exceed $2.500. These forecasts carry high uncertainty and should be read as scenario ranges, not fixed targets.
ether.fi Technical Analysis
The following technical indicators were used to derive the price predictions above.
| Indicator | Value | Signal |
|---|---|---|
| Relative Strength Index (14-Day RSI) | 48.57 | Neutral |
| 50-Day Moving Average | $0.402 | Bullish |
| 200-Day Moving Average | $0.501 | Bearish |
| MACD | 0.0066 | Bearish |
| MACD Histogram | -0.0068 | Negative |
| Average Trading Volume (14-Day) | $34.30M | Declining |
Relative Strength Index (RSI)
The 14-day RSI is at 48.57, signalling neutral (30-70) conditions. The indicator has slipped back below the 50 midline and now sits under its own moving average at 56.03, suggesting the July advance has lost its edge and that the next catalyst will likely determine direction.
Moving Averages (50-Day & 200-Day MA)
ETHFI is holding just above its 50-day MA at $0.402 but remains well below its 200-day MA at $0.501. This reflects a short-term recovery inside a longer downtrend, with the $0.413-$0.418 zone acting as the immediate resistance area that bulls need to reclaim.
MACD (Moving Average Convergence Divergence)
The MACD line at 0.0066 has crossed below the signal line with a histogram of -0.0068, indicating bearish momentum. The bearish crossover suggests growing sell pressure, although the MACD holding above the zero line indicates a loss of momentum rather than a full trend reversal.
Volume Analysis
ether.fi’s average daily trading volume over the past 14 days is approximately $34.30 million. Volume has thinned alongside the pullback, and a clear pickup in participation will be needed to confirm any breakout from the current $0.395-$0.418 consolidation range.
Disclaimer: The above ether.fi price predictions are speculative and based on technical analysis. Crypto markets are highly volatile, and actual prices may differ significantly. Always do your own research (DYOR) before investing.
FAQs
What is the future of Ether.fi (ETHFI)?
Ether.fi’s future looks tied to its role in the decentralized staking and payments infrastructure. With ongoing protocol buybacks, Arthur Hayes’ stablecoin thesis highlighting ETHFI, and its expanding DeFi integrations, analysts expect ETHFI to remain a core player in Ethereum’s liquid staking ecosystem. Long-term adoption and utility growth will determine whether ETHFI sustains its current momentum.
Why is ETHFI falling?
ETHFI price sometimes falls due to profit-taking after sharp rallies, token unlock schedules increasing supply, or broader crypto market corrections. Monitoring buyback activity, DeFi adoption, and Bitcoin dominance can help explain short-term dips in ETHFI price.
What is the ETHFI token unlock schedule?
ETHFI, like many DeFi tokens, follows a vesting and unlock schedule that gradually releases tokens into circulation. Unlocks can create short-term selling pressure if not offset by demand from staking, buybacks, or institutional inflows. Always check the latest ETHFI token unlock dates before making trading decisions.
Where can I find the latest ETHFI news?
You can stay updated on ETHFI news through project announcements, exchange listings, DeFi integrations, and protocol reports. Updates about Ether.fi’s staking products, stablecoin narratives, and buyback programs often impact ETHFI token price in the short term.
What is the ETHFI token price prediction for tomorrow?
Short-term ETHFI token price prediction depends on key support and resistance levels. If ETHFI holds above $1.52, it may attempt to retest $1.68. A drop below $1.52 could invite correction toward $1.45. Traders should also watch RSI and MACD signals for momentum shifts.
What is the ETHFI coin price in INR?
At the current exchange rate (1 USD ≈ ₹83.5), if ETHFI trades at $1.55, the ETHFI coin price in INR would be about ₹129.4. Prices fluctuate with market moves and USD/INR rates, so always check live charts for updated ETHFI INR values.