


Render price prediction has turned bullish after RENDER broke above the $2.27 resistance level and moved near $2.30. The latest Render price chart shows the token trading above key EMAs, supported by renewed AI infrastructure demand, Nvidia-led GPU compute momentum, and stronger on-chain activity. However, RSI near 73 suggests overbought conditions, meaning short-term consolidation is possible before the next move. If RENDER holds above $2.27, the price forecast points toward $2.60–$3.00 in May 2026.
Key Takeaways
- Current Status: Render is trading near $2.30–$2.33, with the latest daily candle showing a gain of over 5%. The token has broken above the important $2.27 level, supported by renewed interest in AI infrastructure, decentralized GPU computing, and broader AI token momentum.
- Market Performance: RENDER has sharply outperformed a relatively flat Bitcoin, driven by sector rotation into AI crypto tokens. Nvidia’s strong revenue results reignited institutional interest in AI and GPU-compute narratives, directly benefiting Render’s decentralized rendering and compute network.
- On-Chain Activity: Render’s on-chain activity has also improved. Daily active addresses reportedly climbed to 394, while 118 new wallets were created in a single day, both reaching their highest levels in 12 weeks. This supports the view that the latest rally is not only speculative but also backed by stronger network participation.
- Technical Analysis: RENDER is trading above the 20, 50, 100, and 200-day EMAs, confirming renewed bullish strength. The 200-day EMA near $2.02 has now turned into an important trend support. However, RSI near 73 suggests overbought conditions, meaning short-term profit booking or consolidation remains possible.
- Render Price Prediction May 2026: The Render price prediction for May 2026 remains bullish as long as the token holds above $2.27. If buying pressure continues, RENDER could move toward $2.50–$2.60, followed by $2.75–$3.00 in the next five days. A break below $2.17–$2.18 may weaken the breakout and trigger a pullback.
- Future Outlook: Render’s price outlook remains closely tied to AI infrastructure demand, decentralized GPU networks, and broader DePIN adoption. If AI token momentum continues and network activity remains strong, RENDER could stay in focus through June and July 2026.
Read more: What is RENDER?
Trade RENDER in INR on ![]()
Deposit and withdraw in INR (₹).
No Conversion to Crypto Required.

Where Will Render Price Head Next?
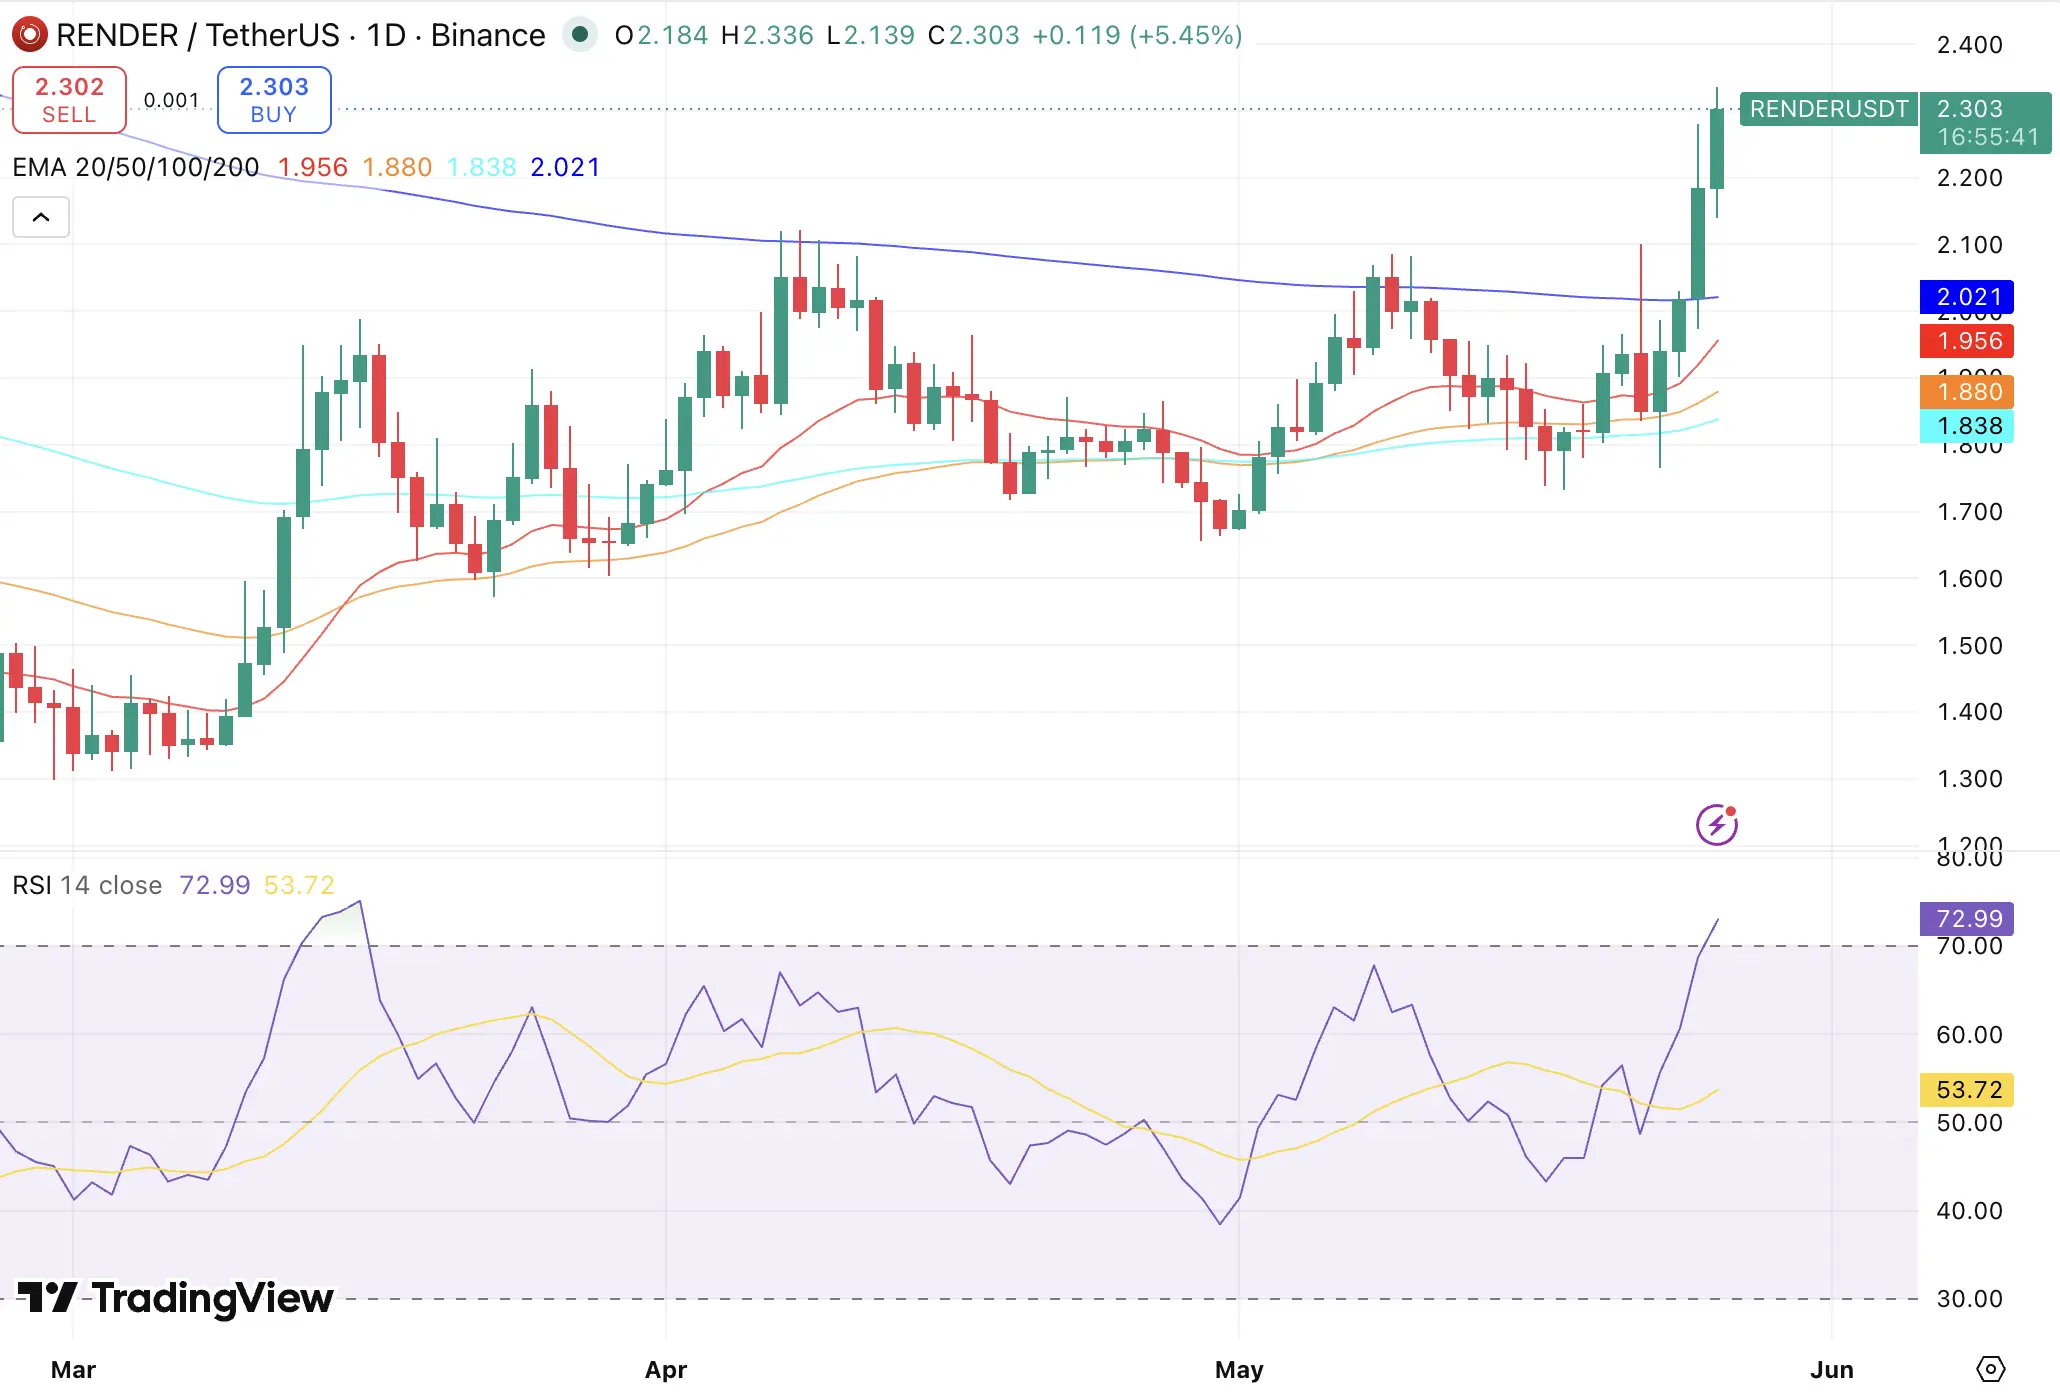
RENDER Price Chart, Source: TradingView
- RENDER/USD is now trading above the 200-day EMA near $2.02. This is usually watched as a longer-term trend indicator. Holding above this level could strengthen the bullish Render price outlook.
- However, RSI near 73 shows that the token is now in overbought territory. This does not immediately mean a reversal, but it suggests that the rally may slow down before the next breakout attempt. If RSI cools while price holds above $2.27, the bullish structure may remain intact.
- On the upside, immediate resistance is now placed near $2.40, followed by $2.50–$2.60. A clean breakout above $2.60 could push RENDER toward $2.75–$3.00. On the downside, the first support lies near $2.27, followed by $2.17–$2.18 and the 200-day EMA near $2.02.
RENDER/USD Technical Overview 2026
| Indicator | $ Value |
|---|---|
| Support levels | $2.27 / $2.17 / $2.02 |
| Resistance levels | $2.40 / $2.60 / $3.0 |
| 20-day EMA | $1.956 |
| 50-day EMA | $1.880 |
| 100-day EMA | $1.838 |
| 200-day EMA | $2.021 |
| RSI | 72 |
Render Price Prediction Daily
The Render price prediction for the next 24 hours remains cautiously bullish. RENDER is holding above the $2.27 breakout level, which has now become the first key support zone. If buyers continue defending this level, the token could move toward $2.40–$2.50 in the near term. However, RSI is already in overbought territory, which means short-term volatility may increase. If profit booking begins, RENDER could retest the $2.17–$2.18 support range before attempting another move higher.
Daily Render price forecast: $2.17–$2.50
Disclaimer: Render coin price predictions are speculative. Markets are volatile; do your own research before investing.
Render Price Prediction Weekly
The weekly Render price outlook has improved after the token broke above the $2.27 resistance level. If RENDER holds above $2.27 through the week, the price could extend toward $2.60, with a stronger breakout opening the path toward $2.75–$3.00. However, if the token fails to hold the breakout zone, it may consolidate between $2.02 and $2.27 before the next move.
The key factor to watch is whether AI narrative momentum continues after Nvidia’s strong results. If AI infrastructure tokens remain in focus, Render could continue attracting trader interest.
Weekly Render price forecast: $2.02–$3.00
Disclaimer: Render coin price predictions are speculative. Markets are volatile; do your own research before investing.
Render Price Prediction May 2026
The Render price prediction for May 2026 has turned bullish after RENDER broke above the $2.27 resistance level. If RENDER holds above $2.27, the token could move toward $2.60–$2.75 by the end of May 2026. A stronger bullish continuation may push the price closer to the $3.00 psychological level. However, the overbought RSI suggests that the rally may not move in a straight line. A short-term pullback toward $2.17–$2.18 or even the 200-day EMA near $2.02 would still keep the broader recovery structure valid, as long as buyers step in around these support zones.
May 2026 Render price forecast: $2.02–$3.00
Render Price Prediction June 2026
By June 2026, Render could continue to benefit from the AI infrastructure and decentralized GPU computing narrative. If the token successfully consolidates above $2.27 and breaks above the $2.60 resistance zone, the next upside range could be $3.10–$3.25. If network activity remains strong and the AI narrative continues, RENDER may remain one of the key tokens to watch in the DePIN and AI crypto sectors.
However, if the token loses momentum and falls below $2.02, the bullish Render price outlook may weaken, leading to a longer consolidation phase.
June 2026 Render price forecast: $2.00–$3.25
Render Price Prediction July 2026
Render’s July 2026 price outlook will depend on whether the token can sustain its breakout structure through June. If RENDER continues to hold above the $2.27 breakout zone and clears $3.00 with strong volume, the price could move toward $3.40–$3.60. A confirmed breakout above $3.00 may also attract momentum traders. On the downside, if overbought conditions lead to a broader correction, RENDER may continue trading between $2.02 and $2.60 before attempting another breakout.
July 2026 Render price forecast: $2.02–$3.60
Render Price Prediction Table 2026-2031
| Year | Min Price ($) | Min (₹) | Avg Price ($) | Avg (₹) | Max Price ($) | Max (₹) | ROI (Avg %) |
| 2026 | 2.80 | ₹242 | 3.20 | ₹277 | 3.80 | ₹329 | — |
| 2027 | 3.50 | ₹303 | 4.40 | ₹381 | 5.20 | ₹451 | +38% |
| 2028 | 4.80 | ₹416 | 6.00 | ₹520 | 7.20 | ₹624 | +87% |
| 2029 | 6.20 | ₹537 | 7.80 | ₹676 | 9.50 | ₹824 | +144% |
| 2030 | 8.50 | ₹737 | 10.80 | ₹936 | 13.00 | ₹1,127 | +238% |
| 2031 | 11.50 | ₹997 | 14.50 | ₹1,257 | 18.00 | ₹1,560 | +353% |
FAQs
What will Render price be in 2025?
Most analyst models place Render (RNDR) between $12 and $26 in 2025, depending on market conditions, AI-narrative strength, and GPU-rendering demand. If adoption accelerates and a broader bull cycle returns, RNDR could revisit or even break its previous all-time highs. Conservative models expect mid-range growth; aggressive models price in strong AI-sector expansion.
Does Render crypto have a future?
Yes. Render has a strong future narrative because it powers decentralized GPU rendering, a sector tied to AI, VFX, gaming, and 3D computing. Its token demand grows as network usage rises, and the project has backing from major industry creators, developers, and studios. Render remains one of the most established AI-crypto projects with long-term relevance.
Is Render a strong buy?
Render is often considered a high-potential AI token, but whether it is a “strong buy” depends on individual risk tolerance. Traders favor RNDR because of:
Its real-world utility (decentralized GPU rendering)
Strong partnerships in media & AI
Continuous network upgrades
High demand during AI market expansions
However, RNDR is still a volatile asset, so it requires careful risk management.
Can Render tokens reach $50?
Render reaching $50 is possible only under strong bull-market conditions, combined with significant demand for decentralized GPU rendering. For RNDR to hit this level, the project would likely need:
Major AI-driven adoption
Sustained network usage
Broader crypto market liquidity returning
Institutional interest in AI infrastructure tokens
It’s a high but not impossible target for long cycles (2026–2028).
Render price prediction in a bull run
If a full crypto bull run occurs, Render could trade in the $22–$45 range, depending on AI sector momentum and overall market risk appetite. AI tokens historically outperform during bullish phases, and Render could benefit from increased GPU network usage and speculative inflows.
Can Render Token reach $100?
Reaching $100 would require Render’s ecosystem to scale massively—potentially becoming a core GPU-rendering layer for AI models, studios, gaming engines, and next-gen digital creators.
While not impossible, $100 would likely be a long-term target achievable only in an extended bull cycle with multi-billion-dollar demand for decentralized compute resources.
