

Pump crypto price prediction explores PUMP’s potential price targets from 2026 to 2040. Analyse daily, weekly and long-term forecasts using RSI, MACD, moving averages, support and resistance levels to understand possible future trends. The guide also covers technical indicators, bullish and bearish scenarios, and key levels that could influence Pump.Fun’s price trajectory over time.
Pump.Fun (PUMP) is currently trading at $0.0021360, reflecting a bullish market sentiment as of July 27, 2026. The 14-day RSI stands at 61.62, signalling neutral-to-bullish conditions, while the 50-day and 200-day moving averages are positioned at $0.0020814 and $0.0020000, respectively. The MACD is positive, indicating bullish short-term momentum, although the latest histogram reading has turned slightly negative. Based on these technical indicators, PUMP is expected to test resistance near $0.00215 while holding support around $0.00208 in the near term.
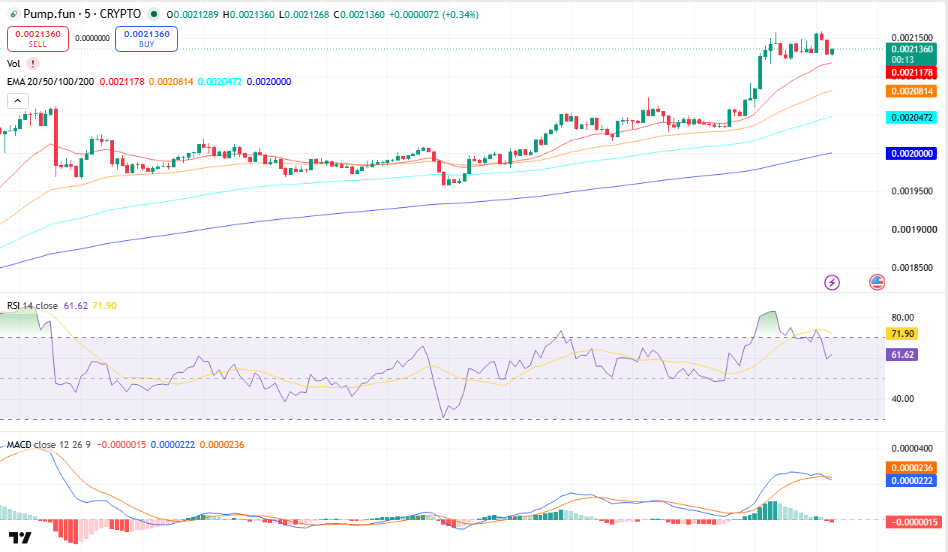
PUMP/USDT, Source: TradingView
Key Insights
● This week: PUMP could trade towards $0.00215 if it holds above $0.00208, while a break below this support may trigger a pullback towards $0.00200.
● August 2026: The token may consolidate above its 200-day MA at $0.00200. A sustained move above $0.00215 could strengthen the bullish setup.
● 2026 and 2030: Based strictly on the supplied chart data, no reliable long-term price targets for 2026 or 2030 can be derived. The current technical setup remains bullish above the $0.00200 long-term moving-average zone.
● Technical analysis: PUMP trades above its 20/50/100/200-day EMA levels, with RSI at 61.62 and MACD still positive, suggesting bullish momentum with some signs of near-term cooling.
Capitalize on the trend: Buy Pump.fun coin
Pump.Fun Short-Term Price Prediction – Today, This Week, August 2026
Here is the Pump Fun price prediction 2026 for today, this week, and August 2026.
| Timeframe | Price Target | Support | Resistance | ROI |
| Next 24 Hrs | $0.00215 | $0.00208 | $0.00215 | +0.66% |
| This Week | $0.00220 | $0.00200 | $0.00220 | +3.00% |
| August 2026 | $0.00230 | $0.00200 | $0.00230 | +7.68% |
Pump.Fun Price Prediction Today
Pump.Fun is trading at $0.0021360 and is expected to range between $0.00208 and $0.00215 in the next 24 hours. The RSI sits at 61.62, while the 50-day EMA at $0.0020814 signals bullish short-term momentum. A hold above $0.00208 targets $0.00215; a break below risks a drop to $0.00200.
Trade PUMP in INR on 
Deposit and withdraw in INR (₹).
No Conversion to Crypto Required.

Pump.Fun Coin Price Prediction for This Week
Pump.Fun is projected to trade between $0.00200 and $0.00220 for the week of July 27-August 2, 2026. PUMP is above the 50-day EMA at $0.0020814, with the MACD histogram recently turning slightly negative after a bullish move, pointing to cooling but still broadly bullish momentum. A weekly close above $0.00215 opens $0.00220; a loss of $0.00200 targets $0.00190.
Pump.Fun Price Prediction for August 2026
Pump.Fun’s August 2026 price prediction targets $0.00230, with a range of $0.00200-$0.00230. Pump is above its 200-day MA at $0.0020000, and the available RSI reading of 61.62 signals neutral-to-bullish conditions. A sustained close above $0.00215 would confirm stronger bullish momentum heading into the following month.
Pump.Fun Coin Price Prediction for September 2026
Pump.Fun’s September 2026 price prediction targets $0.00240, with a range of $0.00200-$0.00240. PUMP is above its 200-day MA at $0.0020000, and the available RSI reading of 61.62 signals neutral-to-bullish conditions. A sustained close above $0.00230 would confirm stronger bullish momentum heading into the fourth quarter of 2026.
Pump Price Prediction 2026 (Medium Term)
| Month | Price Target | Support | Resistance | ROI |
| Aug 2026 | $0.00230 | $0.00200 | $0.00230 | +7.68% |
| Sep 2026 | $0.00240 | $0.00200 | $0.00240 | +12.36% |
| Oct 2026 | $0.00250 | $0.00200 | $0.00250 | +17.04% |
| Nov 2026 | $0.00260 | $0.00200 | $0.00260 | +21.72% |
| Dec 2026 | $0.00270 | $0.00200 | $0.00270 | +26.40% |
Pump.Fun’s 2026 price range is projected at $0.00200-$0.00270, based strictly on the technical levels visible in the supplied charts and a gradual extension of the current bullish structure. The 200-day MA at $0.0020000 is the key bull/bear line — a hold above targets $0.00270, while a break below $0.00200 risks a drop towards the $0.00190 zone. The available MACD reading remains positive, while RSI at 61.62 is trending above the midline, supporting a cautiously bullish technical outlook.
Pump.Fun Price Prediction 2026 to 2040 (Long Term)
| Year | Price Target | Support | Resistance | ROI |
| 2027 | $0.00300 | $0.00200 | $0.00350 | +40.45% |
| 2028 | $0.00350 | $0.00250 | $0.00400 | +63.86% |
| 2029 | $0.00400 | $0.00300 | $0.00500 | +87.27% |
| 2030 | $0.00450 | $0.00350 | $0.00550 | +110.67% |
| 2031 | $0.00500 | $0.00400 | $0.00600 | +134.08% |
| 2035 | $0.00700 | $0.00500 | $0.00800 | +227.65% |
| 2040 | $0.01000 | $0.00700 | $0.01200 | +368.16% |
Pump Fun Price Prediction 2030: What Is the Expected Price?
Pump Fun price prediction 2030 targets $0.00450, within a range of $0.00350-$0.00550, based on a long-term extrapolation of the bullish price structure visible in the supplied chart. Since the provided data contains only historical price action and technical indicators, there is no basis to apply Bitcoin halving, mining scarcity, Stock-to-Flow, Power Law, or institutional adoption assumptions. The PUMP coin price prediction 2030 should therefore be treated as a technical scenario rather than a fixed forecast.
Pump.Fun 2031 Outlook and Expected Price Range
The Pump.Fun price prediction for 2031 targets $0.00500, with a range of $0.00400-$0.00600, assuming the long-term upward structure visible on the supplied chart continues. The available data does not provide on-chain metrics such as LTH supply, exchange reserves, or realised price, so these factors cannot be used to validate the projection. The PUMP price outlook remains highly uncertain over such a long timeframe.
Pump.Fun price prediction 2040: Long-Term Forecast
By 2040, Pump.Fun’s price is projected at $0.01000, ranging from $0.00700 to $0.01200, based solely on a long-term extrapolation of the price trend shown in the supplied charts. The provided data does not contain information required to apply Metcalfe’s Law, Power Law, supply-based models, or adoption scenarios. The PUMP price forecast therefore carries very high uncertainty and should be read as a scenario range, not a fixed target.
Pump.Fun Technical Analysis
The following technical indicators were used to derive the price predictions above. Each indicator’s value and signal should be updated at the time of publishing.
| Indicator | Value | Signal |
| Relative Strength Index (14-Day RSI) | 61.62 | Neutral |
| 50-Day Moving Average | $0.0020814 | Bullish |
| 200-Day Moving Average | $0.0020000 | Bullish |
| MACD | 0.00000222 | Bullish |
| MACD Histogram | -0.00000015 | Negative |
Relative Strength Index (RSI)
The 14-day RSI is at 61.62, signalling neutral conditions. The indicator remains below the 70 overbought threshold while holding above the 50 midline, suggesting that bullish momentum is present without the market being technically overbought.
Moving Averages (50-Day & 200-Day MA)
PUMP is above its 50-day MA at $0.0020814 and above its 200-day MA at $0.0020000. This alignment indicates a bullish macro momentum structure, with the $0.0020000 level acting as an important long-term support zone based on the supplied chart.
MACD (Moving Average Convergence Divergence)
The MACD is above the signal line, with a histogram of -0.00000015, indicating mixed momentum with a slight near-term bearish shift. Although the MACD remains positive at 0.00000222, the negative histogram suggests that bullish momentum has recently slowed and could lead to short-term consolidation.
Volume Analysis
Pump.Fun’s trading volume has increased alongside the recent price rally, supporting the bullish move and indicating stronger market participation. However, the latest volume appears to be cooling as momentum slows, suggesting possible consolidation or a short-term pullback unless buying activity increases again.
FAQs
1. What is the PUMP token?
The $PUMP token is the native token of Pump.fun, a Solana-based memecoin launchpad aiming to disrupt Web2 social platforms. Designed to power a creator-first ecosystem, $PUMP gives communities the ability to support and profit from the creators they follow.
2. Where can I buy $PUMP crypto?
You can buy $PUMP tokens directly through the Pump.fun website during the ICO (July 12–15, 2025), or through supported exchanges like CoinDCX. KYC is required, and the sale is restricted in the U.S., U.K., and EU-regulated platforms.
3. What is the PUMP price prediction for 2026?
The PUMP price prediction for 2026 remains highly speculative because the token is closely linked to memecoin activity and market sentiment. Its performance will likely depend on Pump.fun’s revenue, token utility, ecosystem incentives, buyback activity, and the overall strength of the crypto market.
4. What is the Pump.fun price prediction for 2030?
The Pump.fun price prediction for 2030 depends on whether the platform can maintain its position in the memecoin-launch market and build lasting demand for the PUMP token. Long-term growth would require continued platform usage, sustainable revenue, stronger token utility, and favourable regulatory and market conditions.
5. Can PUMP coin reach $1?
PUMP could theoretically reach $1, but doing so would require a substantial increase in demand and an extremely large market capitalization based on its circulating token supply. Therefore, a $1 PUMP price should be treated as a highly speculative long-term scenario rather than a reliable forecast.
6. Is Pump.fun coin a good investment?
Pump.fun may appeal to investors seeking exposure to the Solana memecoin ecosystem, but PUMP is a high-risk and highly volatile crypto asset. Before investing, consider its token supply, platform revenue, utility, buyback mechanism, competition, regulatory risks, and your ability to absorb potential losses.
7. What factors can affect the price of PUMP?
The PUMP price can be influenced by Pump.fun platform activity, memecoin-launch volumes, protocol revenue, token buybacks, staking or fee-sharing incentives, Solana network growth, exchange listings, regulatory developments, and broader crypto-market sentiment.
8. Can the Pump.fun price recover?
PUMP may recover if buyers reclaim important resistance levels and the Pump.fun ecosystem records stronger activity, revenue, or token demand. However, a sustainable recovery generally requires both improving technical momentum and supportive fundamentals; a short-term price bounce alone does not confirm a longer-term reversal.
9. Why is the Pump.fun price so volatile?
Pump.fun is highly volatile because its demand is closely connected to speculative memecoin trading. Changes in platform activity, token launches, trader sentiment, liquidity, whale transactions, and the wider Solana market can produce sharp PUMP price movements over short periods.
10. What is the Pump.fun price prediction in INR?
The Pump.fun price in INR is determined by the PUMP/USD market price and the prevailing USD/INR exchange rate. Consequently, PUMP may move in rupee terms even when its dollar price changes only slightly. Readers should check a live PUMP-to-INR converter for the latest value.
11. Where can I check the live Pump.fun price?
The live Pump.fun price, market capitalization, trading volume, circulating supply, and historical chart can be checked on established crypto data platforms or supported exchanges. Because crypto prices change continuously, live market data should be used alongside, not replaced by, long-term PUMP price predictions.