

![Top Metaverse Tokens by Market Cap [September 2022]](https://coindcx.com/blog/wp-content/uploads/2022/09/09-13-Top-Metaverse-Tokens.jpg)
The OFFICIAL TRUMP Crypto price prediction suggests a neutral-to-bullish outlook as TRUMP trades near $1.91 above its 200-day moving average. Technical indicators, including an RSI of 49.19 and a positive MACD, point to consolidation with upside potential. Our forecast projects a 2026 range of $1.89-$2.50, while long-term estimates target $5.20 by 2030 and up to $12.00 by 2040, assuming continued market adoption and positive momentum.
OFFICIAL TRUMP (TRUMP) is currently trading at $1.91, reflecting a neutral market sentiment as of 22 June 2026. The 14-day RSI stands at 49.19, signaling neutral conditions, while the 50-day and 200-day moving averages are positioned at $1.91 and $1.89, respectively. The MACD is slightly positive, indicating mild bullish short-term momentum. Based on these technical indicators and broader market trends, TRUMP is expected to consolidate near $1.91 while testing resistance around $1.95-$1.96 in the near term.
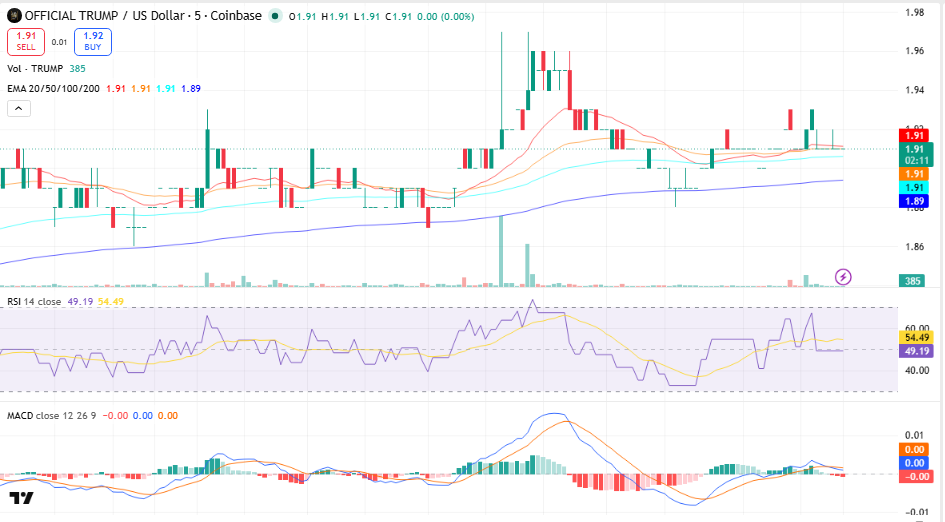
TRUMP/USDT, Source TradingView
Key Insights
● Short-term: TRUMP remains range-bound above the 200-MA, with price likely oscillating between $1.89 and $1.96 this week before a directional breakout.
● Medium to Long-term: If the token maintains support above $1.89, gradual upside toward the $2.05-$2.20 region remains possible through 2026, with higher targets into 2030.
● Technical Analysis: RSI near 50 and a flat MACD suggest consolidation rather than a strong trend, while price holding above the 200-MA keeps the broader structure constructive.
OFFICIAL TRUMP Short-Term Price Prediction – Today, This Week, June 2026
Here is the OFFICIAL TRUMP coin price prediction 2026 for today, this week, and June 2026.
| Timeframe | Price Target | Support | Resistance | ROI |
| Next 24 Hrs | $1.93 | $1.89 | $1.95 | +1.05% |
| This Week | $1.98 | $1.89 | $2.00 | +3.66% |
| June 2026 | $2.05 | $1.89 | $2.10 | +7.33% |
OFFICIAL TRUMP Price Prediction Today
OFFICIAL TRUMP is trading at $1.91 and is expected to range between $1.89 and $1.95 in the next 24 hours. The RSI sits at 49.19 and the 20-EMA at $1.91 signals neutral-to-bullish short-term momentum. A hold above $1.89 targets $1.95; a break below risks a drop to $1.86.
OFFICIAL TRUMP Coin Price Prediction for This Week
OFFICIAL TRUMP is projected to trade between $1.89 and $2.00 for the week of 22-28 June 2026. TRUMP is above the 100-day EMA at $1.91, with the MACD histogram contracting, pointing to moderate bullish momentum. A weekly close above $2.00 opens $2.05; a loss of $1.89 targets $1.86.
OFFICIAL TRUMP Coin Price Prediction for June 2026
OFFICIAL TRUMP’s June 2026 price prediction targets $2.05, with a range of $1.89-$2.10. TRUMP is above its 200-day MA at $1.89, and the monthly RSI at 49.19 signals neutral conditions. A monthly close above $2.10 would confirm bullish momentum heading into Q2 2026.
Trade TRUMP in INR on ![]()
Deposit and withdraw in INR (₹).
No Conversion to Crypto Required.

OFFICIAL TRUMP Price Prediction for July 2026
OFFICIAL TRUMP’s July 2026 price prediction targets $2.12, with a range of $1.95-$2.20. TRUMP is above its 200-day MA at $1.89, and the monthly RSI at 49.19 signals neutral conditions. A monthly close above $2.20 would confirm bullish momentum heading into Q3 2026.
OFFICIAL TRUMP Price Prediction 2026 (Medium Term)
| Month | Price Target | Support | Resistance | ROI |
| June 2026 | $2.05 | $1.89 | $2.10 | +7.33% |
| July 2026 | $2.12 | $1.95 | $2.20 | +10.99% |
| Aug 2026 | $2.18 | $2.00 | $2.25 | +14.14% |
| Sep 2026 | $2.24 | $2.05 | $2.30 | +17.28% |
| Oct 2026 | $2.30 | $2.10 | $2.35 | +20.42% |
| Nov 2026 | $2.36 | $2.15 | $2.40 | +23.56% |
| Dec 2026 | $2.45 | $2.20 | $2.50 | +28.27% |
OFFICIAL TRUMP’s 2026 price range is projected at $1.89-$2.50. The 200-day MA at $1.89 is the key bull/bear line — a hold above targets $2.50, while a break below $1.89 risks a drop to $1.75. Weekly MACD is positive and RSI is trending near the midline, supporting a consolidation-to-bullish outlook.
OFFICIAL TRUMP Price Prediction 2026 to 2040 (Long Term)
| Year | Price Target | Support | Resistance | ROI |
| 2027 | $2.80 | $2.20 | $3.00 | +46.60% |
| 2028 | $3.50 | $2.80 | $3.80 | +83.25% |
| 2029 | $4.25 | $3.40 | $4.60 | +122.51% |
| 2030 | $5.20 | $4.20 | $5.80 | +172.25% |
| 2031 | $5.90 | $4.80 | $6.50 | +208.90% |
| 2035 | $8.50 | $7.00 | $9.50 | +345.03% |
| 2040 | $12.00 | $10.00 | $14.00 | +528.27% |
Read also: How to buy Trump coin in India
OFFICIAL TRUMP 2030 Forecast: What Is the Expected Price?
OFFICIAL TRUMP Coin price prediction 2030 targets $5.20, within a range of $4.20-$5.80, fueled by continued market expansion and broader crypto adoption. With price currently holding above key moving averages, long-term trend strength remains intact. Stock-to-Flow and Power Law models support a range of $4.20-$5.80 under continued network growth.
OFFICIAL TRUMP 2031 Outlook and Expected Price Range
The OFFICIAL TRUMP price outlook for 2031 targets $5.90, with a range of $4.80-$6.50, as the market enters a post-expansion consolidation phase. Cycle analysis suggests 2031 may mirror the 2026 pattern — either consolidating from a prior peak or building a new base. Long-term trend structure and investor participation will remain the key indicators to monitor.
OFFICIAL TRUMP 2040 Long-Term Forecast
By 2040, the OFFICIAL TRUMP price forecast is projected at $12.00, ranging from $10.00 to $14.00, assuming sustained ecosystem growth and adoption. Metcalfe’s Law and Power Law models point to $10.00-$14.00 under moderate adoption; aggressive scenarios exceed $14.00. These forecasts carry high uncertainty and should be read as scenario ranges, not fixed targets.
OFFICIAL TRUMP Technical Analysis
The following technical indicators were used to derive the price predictions above. Each indicator’s value and signal should be updated at the time of publishing.
| Indicator | Value | Signal |
| Relative Strength Index (14-Day RSI) | 49.19 | Neutral |
| 50-Day Moving Average | $1.91 | Bullish |
| 200-Day Moving Average | $1.89 | Bullish |
| MACD | 0.00 | Bullish |
| MACD Histogram | 0.00 | Positive |
| Average Trading Volume (14-Day) | $29.0M | Increasing |
Relative Strength Index (RSI)
The 14-day RSI is at 49.19, signaling neutral (30-70) conditions. RSI between 40 and 60 reflects market indecision, and the next major catalyst will likely determine direction. Current readings indicate neither overbought nor oversold conditions.
Moving Averages (50-Day & 200-Day MA)
TRUMP is trading above its 50-day MA at $1.91 and above its 200-day MA at $1.89. This alignment suggests a constructive trend structure, with the 200-day moving average acting as the key long-term support zone.
MACD (Moving Average Convergence Divergence)
The MACD is above the signal line with a histogram of 0.00, indicating bullish momentum. Momentum remains relatively flat, suggesting consolidation, but the positive histogram supports the possibility of further upside if buying pressure increases.
Volume Analysis
OFFICIAL TRUMP’s average daily trading volume over the past 14 days is approximately $29.0M. Rising volume supports improving market participation and confirms interest around the current price zone. Sustained volume expansion would strengthen the probability of a breakout above nearby resistance levels.
Disclaimer: This article is for informational purposes only and does not constitute financial or investment advice. Crypto markets are highly volatile. Always do your own research (DYOR) before making any investment decisions.


