

NEAR extends its breakout above $4, though an overbought Relative Strength Index (RSI) raises the odds of a short-term cooldown within the broader uptrend. This Near Protocol crypto price prediction provides an analysis of NEAR’s potential trajectory across short-, medium-, and long-term horizons. Using technical indicators including the RSI, volume analysis, and the 20-day, 50-day, 100-day, and 200-day exponential moving averages (EMAs), this forecast evaluates market momentum and structural trend strength. Explore NEAR price projections for today, this week, 2026, and multi-year scenarios through 2040 based on prevailing market conditions and chart structure.
Near Protocol (NEAR) Price Prediction 2026, 2027-2030 and Beyond
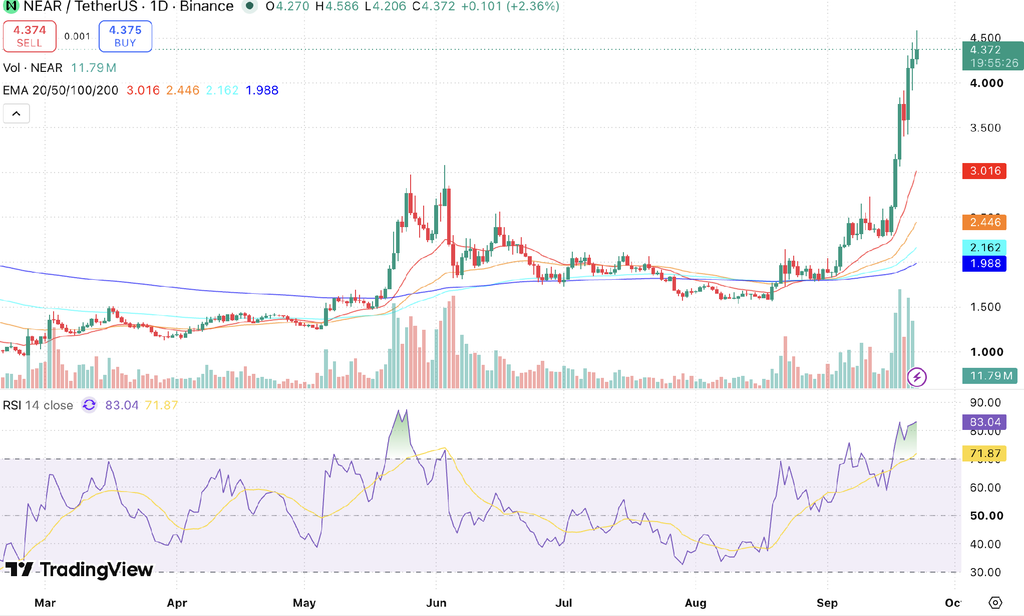
Near Protocol (NEAR) trades near $4.372, reflecting strongly bullish market sentiment as of September 22, 2026, up 2.36% on the session following an aggressive expansion from its multi-month base. The 14-day RSI stands at 83.04, signaling extended overbought conditions, while the 20-day and 50-day EMAs are positioned at $3.016 and $2.446, respectively, leaving spot price well clear of dynamic trendlines. Based on these technical indicators and current breakout volume, NEAR is expected to test overhead resistance between $4.58 and $5.00 while finding primary support around the $3.80 to $4.20 band in the near term.
Key Insights
- Weekly Outlook: NEAR trades 44.96% above its 20-day EMA at $3.016 following a sharp impulse out of the $1.60 to $2.00 base established in early September. A confirmed weekly close above $4.60 opens a direct path toward $5.00.
- Monthly & 2026 Outlook: Sustained momentum across decentralized AI narratives could drive NEAR toward the $6.00 to $6.80 zone by December 2026. However, an intermediate mean-reversion retest toward $3.50 to $3.80 remains a technical possibility given how far spot price has decoupled from its moving averages.
- Long-Term Outlook (2030): Continued ecosystem growth and adoption could support a broader range of $16.00-$26.00 by 2030, subject to overall crypto market conditions.
- Technical Analysis: RSI at 83.04 is deep in overbought territory, a level last seen near NEAR’s June 2026 peak, which points to rising odds of a near-term cooldown even as the broader structure stays bullish.
NEAR/USDT, Source TradingView
Near Protocol Short-Term Price Prediction – Today, This Week, September 2026
Here is the Near Protocol coin price prediction for today, this week, and September 2026.
| Timeframe | Price Target | Support | Resistance | ROI |
|---|---|---|---|---|
| Next 24 Hrs | $4.45 | $4.20 | $4.58 | +1.78% |
| This Week | $4.60 | $3.80 | $5.00 | +5.22% |
| September 2026 | $5.00 | $3.60 | $5.60 | +14.36% |
Near Protocol Price Prediction Today
Near Protocol is trading at $4.372 and is expected to range between $4.20 and $4.58 in the next 24 hours. The RSI sits at 83.04 and the 20-EMA at $3.016 signals strong bullish momentum, though the gap between price and the EMA is wide enough to invite a pullback. A hold above $4.20 targets $4.58; a break below risks a drop to $3.80.
Near Protocol Price Prediction for This Week
Near Protocol is projected to trade between $3.80 and $5.00 for the week of September 22-28, 2026. NEAR is trading well above its 100-day EMA at $2.162, with RSI at 83.04 signaling an overbought stretch even as the broader trend stays bullish. A weekly close above $4.60 opens $5.00; a loss of $3.80 targets $3.50.
Near Protocol Price Prediction for September 2026
Near Protocol’s September 2026 price prediction targets $5.00, with a range of $3.60-$5.60. NEAR is trading well above its 200-day EMA at $1.988, and the monthly RSI at 83.04 signals overbought conditions. A monthly close above $4.80 would confirm continuation of the current breakout into Q4 2026.
Trade NEAR in INR on CoinDCX — Deposit and withdraw in INR (₹). No Conversion to Crypto Required.
Near Protocol Price Prediction for October 2026
Near Protocol’s October 2026 price prediction targets $5.40, with a range of $4.20-$6.00. NEAR is expected to trade above its 200-day EMA at $1.988, and the monthly RSI is likely to cool from current overbought levels toward the 60-70 range. A monthly close above $5.40 would confirm bullish momentum heading into November 2026.
Near Protocol Coin Price Prediction 2026 (Medium Term)
| Month | Price Target | Support | Resistance | ROI |
|---|---|---|---|---|
| Sep 2026 | $5.00 | $3.60 | $5.60 | +14.36% |
| Oct 2026 | $5.40 | $4.20 | $6.00 | +23.51% |
| Nov 2026 | $5.80 | $4.60 | $6.40 | +32.66% |
| Dec 2026 | $6.20 | $5.00 | $6.80 | +41.82% |
| Jan 2027 | $6.60 | $5.40 | $7.20 | +50.96% |
| Feb 2027 | $7.00 | $5.80 | $7.60 | +60.12% |
| Mar 2027 | $7.40 | $6.20 | $8.00 | +69.27% |
Near Protocol’s 2026 medium-term price channel is projected at $3.60 to $6.80, driven by decentralized AI integrations and broader digital asset market participation. The ascending 20-day EMA at $3.016 provides trailing trendline support. Holding above this moving average keeps upside targets of $5.60 to $6.80 active, while a confirmed daily breakdown below $3.016 would expose the 50-day EMA near $2.45. An RSI cooldown toward 60–70 represents standard trend consolidation rather than structural invalidation.
Near Protocol Price Prediction 2026 to 2040 (Long Term)
| Year | Price Target | Support | Resistance | ROI |
|---|---|---|---|---|
| 2027 | $9.50 | $7.00 | $11.50 | +117.34% |
| 2028 | $13.00 | $10.00 | $16.00 | +197.35% |
| 2029 | $16.50 | $13.00 | $20.00 | +277.49% |
| 2030 | $21.00 | $16.00 | $26.00 | +380.39% |
| 2031 | $18.50 | $14.00 | $23.00 | +323.19% |
| 2035 | $32.00 | $25.00 | $40.00 | +632.11% |
| 2040 | $55.00 | $40.00 | $70.00 | +1158.09% |
Where Will Near Protocol Price Go in 2030?
The 2030 projection targets $21.00, within an estimated corridor of $16.00 to $26.00, supported by user chain-abstraction adoption, AI-agent data layer utility, and broader digital asset market liquidity. Sustained developer activity and smart-contract settlement volume form the fundamental thesis behind this long-term expansion.
Where Will Near Protocol Price Go in 2031?
The Near Protocol price forecast for 2031 targets $18.50, with a range of $14.00-$23.00, as the market enters a post-cycle consolidation phase. Cycle analysis suggests 2027 pattern similarities — either consolidating from a prior peak or establishing a new long-term base. Long-term holder supply and exchange reserve trends will be key on-chain signals to monitor.
Where Will Near Protocol Prices Go in 2040?
By 2040, Near Protocol price outlook projects an average value of $55.00, ranging from $40.00 to $70.00, assuming sustained adoption of decentralized applications, AI infrastructure, and Web3 services. Metcalfe’s Law and Power Law models point to $45.00-$75.00 under moderate adoption; aggressive scenarios exceed $100.00. These forecasts carry high uncertainty and should be read as scenario ranges, not fixed targets.
Near Protocol Technical Analysis
The following technical indicators were used to derive the price predictions above. Each indicator’s value and signal should be updated at the time of publishing.
| Indicator | Value | Signal |
|---|---|---|
| Relative Strength Index (14-Day RSI) | 83.04 | Overbought |
| RSI Signal Line | 71.87 | Overbought |
| 20-Day EMA | $3.016 | Bullish |
| 50-Day EMA | $2.446 | Bullish |
| 100-Day EMA | $2.162 | Bullish |
| 200-Day EMA | $1.988 | Bullish |
| 24-Hour Change | +2.36% (+$0.101) | Bullish |
| 24-Hour Range | $4.206 – $4.586 | Volatile |
| Trading Volume (Session) | 11.79M NEAR | Elevated |
Relative Strength Index (RSI)
The 14-day RSI stands at 83.04, sitting 11.17 points above its signal average of 71.87. This reading marks deep overbought territory, comparable to the levels recorded during the June 2026 advance near $3.15. While overbought RSI readings can persist during high-momentum breakouts, they increase the probability of an intermediate consolidation range before buyers attempt higher resistance.
Moving Averages (20/50/100/200-Day EMA)
NEAR is trading well above all four exponential moving averages, with the 20-day EMA at $3.016 acting as the nearest dynamic support. This reflects a strong bullish structure, though the wide gap between spot price and the shorter-term EMAs suggests the move is extended and vulnerable to a mean-reversion pullback.
Volume Analysis
NEAR’s current session volume stands at 11.79M NEAR, with the day’s range spanning $4.206 to $4.586 — a roughly 9% intraday swing that points to elevated volatility around the breakout. Volume bars are visibly outpacing the quieter ranges seen through July and August. Rising volume alongside the price breakout supports the current move, though traders should watch for a volume decline as an early signal of fading conviction near resistance.
FAQs
Will the Near Protocol price ever hit $100?
The Near Protocol price may rise if the markets maintain a healthy upswing and the tokens in circulation, which are above a billion, are destroyed by over 50%. This may cause a shortage and eventually elevate the price to $100 in the future.
What will Near Protocol be worth in 2025?
The NEAR price may trade between $18 and $19 in 2025.
What will be the price of 1 NEAR in 2030?
The price of 1 NEAR may trade between $45 and $52 in 2030.
Is Near Protocol a safe investment?
The forecast of the NEAR price in the long term is quite positive and is expected to trigger a strong bull run in the coming days. Therefore, with deep research and close price analysis, investing in Near Protocol may be profitable
What was Near Protocol’s highest price?
The highest price achieved by Near Protocol was $20.42 on January 17, 2022.
Disclaimer: This article is for informational purposes only and does not constitute financial or investment advice. Crypto markets are highly volatile. Always do your own research (DYOR) before making any investment decisions.