


Movement (MOVE) is currently trading around $0.042 after exhibiting a sharp double-digit gain in value, signaling renewed buying interest after the extended period of decline. Although the overall market trend continues to be cautious in nature, improving momentum, rising RSI, and a breakout above short-term EMAs suggest early trend stabilization. With growing attention around Movement’s Layer-1 ambitions and ecosystem development, MOVE shows potential for a gradual recovery heading into 2026.
Key Takeaways
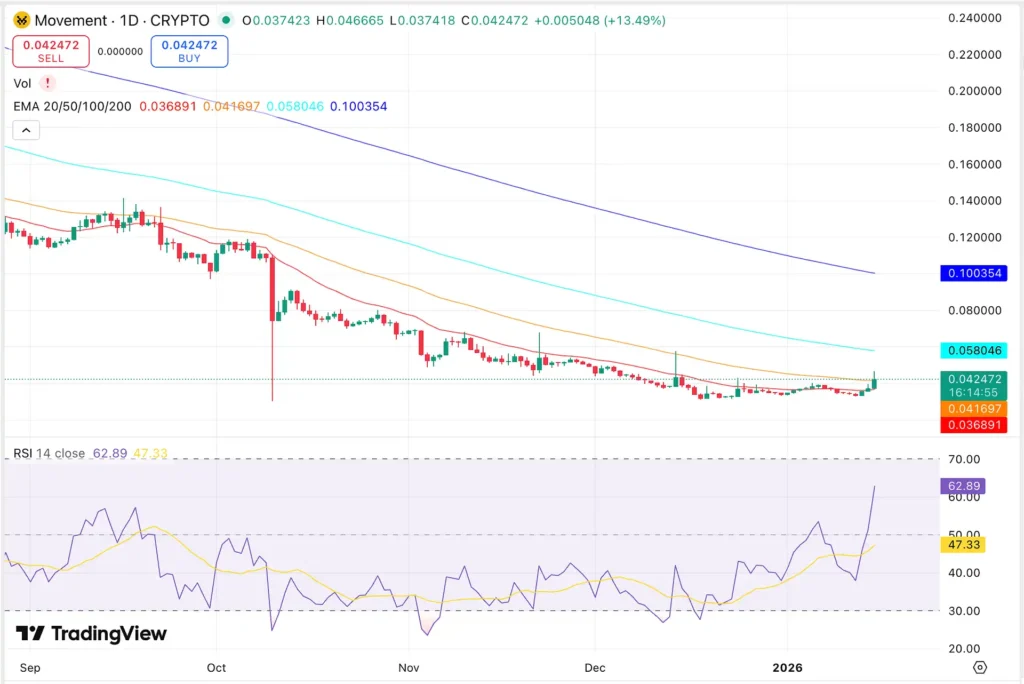
Current Status: Currently, MOVE trades at $0.042, having surged by over 13% during the last trading session, indicating a strong recovery from a trough. This price action seems to be backed by accumulation and a technical break-out above the 20-day EMA. Meanwhile, a strong RSI above the neutral line also shows increasing market sentiment as buyers attempt to reclaim control near the $0.040 support region.
Market Performance: The market performance of Movement has been fluctuating, with a market cap of approximately $135 million and a 24-hour trading volume of over $150 million, which indicates a tremendous amount of trading activity among investors. Despite sustained pressure in previous months, MOVE continues to attract liquidity, suggesting the token remains actively traded within the small- to mid- cap segment.
Technical Analysis: MOVE has successfully moved above the 20-day EMA (~$0.0369) and is currently trading slightly above the 50-day EMA (~$0.0417), which now acts as immediate support. However, the 100-day EMA near $0.058 remains a critical upside barrier, while the 200-day EMA at $0.10 defines the long-term bearish ceiling. RSI stands near 63, confirming strengthening momentum without entering overbought territory. A sustained hold above $0.040 could allow further upside, while a rejection may push the price back toward lower consolidation zones.
Movement Price Prediction January 2026: Based on current trend recovery, EMA positioning, and momentum indicators, Movement price prediction models point to a potential move toward the $0.055–$0.065 range by January 2026, assuming market conditions stabilize and buying interest remains consistent. This projection factors in MOVE’s historical tendency to rebound sharply after extended downtrends once volume returns.
Future Outlook: Movement (MOVE) enters 2026 at a technical crossroads. Although the long-term trend is bearish, the short-term structure has been improving as the price tries to get back above key EMAs. As time goes on and development continues with Movement’s solo Layer-1 roadmap and participation in the ecosystem grows, investors will become more confident. If adoption and network activity grow at a reasonable and consistent pace, MOVE could slowly work its way into higher resistance areas throughout the 2026-2030 cycle.
Where Will Movement (MOVE) Price Head Next?
Movement is trading above its shorter-term EMAs, marking an initial positive trend change after several months of downward pressure. The $0.040–$0.038 level is currently seen as immediate support, where buyers have shown strong interest in defending recent gains.
On the upside, the resistance at $0.046-$0.050 is one of the major resistances because it was previously rejected; this indicates the presence of sellers at these levels. A breakout at these levels may result in a rise to the level of $0.058, which is at the 100 EMA.
RSI momentum continues to strengthen, suggesting buyers are gaining control, while volume expansion supports the possibility of further upside. However, failure to hold above the 50-day EMA could trigger a short-term pullback toward $0.035.
If MOVE maintains support above $0.040, the probability of a gradual recovery remains high. Conversely, losing this level could delay bullish continuation and keep the price range-bound.
Trade MOVE in INR on ![]()
Deposit and withdraw in INR (₹).
No Conversion to Crypto Required.

MOVE/USD Technical Overview – 2026
| Indicator | Value |
| Support levels (Fibonacci, S1/S2/S3) | $0.040 / $0.035 / $0.030 |
| Resistance levels (Fibonacci, R1/R2/R3) | $0.046 / $0.050 / $0.058 |
| 20-day EMA | $0.0369 |
| 50-day EMA | $0.0417 |
| 100-day EMA | $0.0580 |
| 200-day EMA | $0.1003 |
| RSI (14) | 62.9 |
Movement Price Prediction Daily
Movement is trading near $0.042 after breaking above its short-term EMAs, signaling a short-term shift in momentum. If buying volume continues to expand, a 5–8% upside move is possible, placing the next immediate target around $0.046–$0.048 within the next 24 hours.
However, a rejection near this resistance could trigger a mild pullback toward the $0.040 support zone, where buyers have previously stepped in. Overall, short-term sentiment remains moderately bullish as long as MOVE holds above $0.038.
Disclaimer: Movement price prediction figures are speculative. Crypto markets are volatile; always conduct your own research before investing.
Movement Price Prediction Weekly
Movement is currently fluctuating between $0.038 and $0.046, reflecting a tightening range after a strong rebound. Weekly price forecasts suggest a 10–15% upside potential, with $0.050 acting as the first meaningful target if momentum sustains.
Bullish continuation will depend on the price holding above the 50-day EMA, while a drop below $0.038 may indicate renewed selling pressure and a retest of lower support zones.
Disclaimer: Movement price predictions are speculative. Markets are volatile; do your own research before investing.
Movement Price Prediction (January 2026)
Entering 2026, Movement may continue its gradual recovery if broader market conditions remain supportive. Based on current EMA structure, RSI momentum, and historical rebound behavior, Movement price prediction January 2026 models point toward a potential 30–40% increase, placing MOVE in the $0.055–$0.065 range.
A sustained break above the 100-day EMA near $0.058 would be critical to confirming a stronger bullish structure and improving long-term sentiment.
Movement Price Prediction (February 2026)
The price forecast for Movement in February 2026 remains cautiously optimistic. However, if adoption figures continue to improve and price stays above key EMAs, it will help MOVE gain another 20-30% to possibly test levels at $0.070.
A more prominent breakout with support from volume may temporarily propel the price towards the resistance range of $0.075-$0.080, although profit–taking activities may be observed around these levels.
MOVE Coin Price in INR
| MOVE Amount | Price in INR (Approx.) |
| 1 MOVE | ₹3.50 |
| 5 MOVE | ₹17.50 |
| 10 MOVE | ₹35.00 |
| 25 MOVE | ₹87.50 |
| 50 MOVE | ₹175.00 |
| 100 MOVE | ₹350.00 |
(INR values are approximate and based on current exchange rates.)
MOVE Price Prediction Table (2026–2030)
| Year | Min (USD) | Min (INR) | Avg (USD) | Avg (INR) | Max (USD) | Max (INR) | ROI (Avg %) |
| 2026 | 0.05 | ₹4.2 | 0.07 | ₹5.9 | 0.09 | ₹7.6 | +32% |
| 2027 | 0.07 | ₹5.9 | 0.10 | ₹8.4 | 0.14 | ₹11.8 | +68% |
| 2028 | 0.10 | ₹8.4 | 0.15 | ₹12.6 | 0.20 | ₹16.8 | +124% |
| 2029 | 0.15 | ₹12.6 | 0.22 | ₹18.5 | 0.30 | ₹25.2 | +198% |
| 2030 | 0.22 | ₹18.5 | 0.32 | ₹26.9 | 0.45 | ₹37.8 | +285% |


