Kaspa Price Prediction: Can KASPA Price Breach ATH & Jump 2x in 2024?

Explore Kaspa's bullish momentum and potential for new highs.
Kaspa price prediction points to a potential move toward $0.060–$0.070 as KAS defends the $0.048–$0.050 base, with improving sentiment and steady network fundamentals.

Key Takeaways

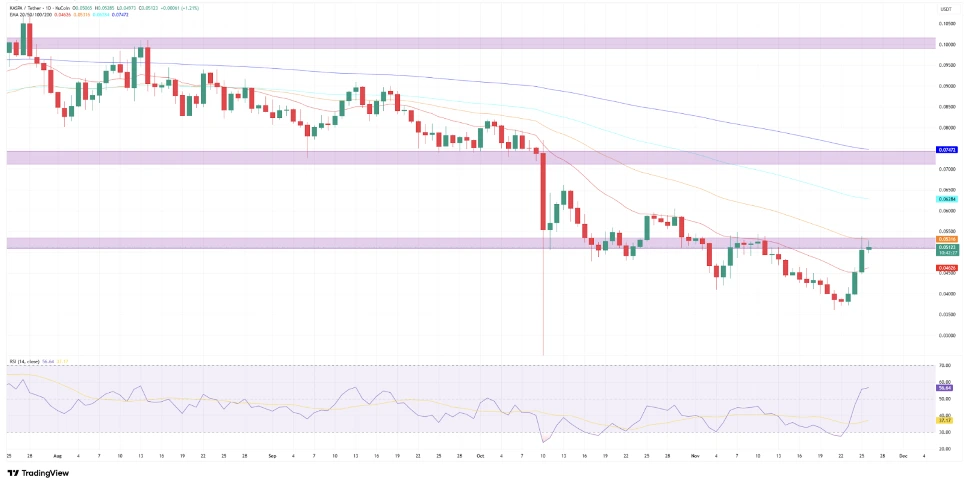
  • Kaspa’s Current Status: Kaspa price is trading at
    Loading…
    bouncing off the lower horizontal support band you’ve marked near $0.048-0.050. After months of lower highs from the mid-year peak, the price is now pressed toward the bottom of the wider range, with this zone acting as the main “last line” of short-term support. Candles have started to turn back up from that base, hinting more at seller exhaustion and a relief bounce than at a confirmed trend reversal.
  • Market performance: Over the last year, KAS has cooled off significantly from its explosive move to the $0.18-0.20 area and has been in a slow grind down, underperforming majors like BTC and ETH during recent risk-off phases. It still trades with healthy liquidity and strong retail/miner interest thanks to its fast proof-of-work block DAG design. Still, the market has clearly shifted from “euphoria” to “value-hunting” — most of the action lately has been range-trading between your marked support and resistance bands rather than trending in a straight line.

  • Technical analysis: The key support is $0.048-0.050, which has held multiple times, including after the sharp October wick. A daily close below it could send the price toward $0.035-$0.038. On the upside, the first hurdle is $0.060-0.062, followed by heavier resistance at $0.075-0.080 and $0.095-0.10. Since mid-year, KAS has been making lower highs from $0.13-0.14 down through $0.10 and $0.08, so bulls need to turn this bounce into a higher low and reclaim at least $0.06-0.07; until then, rallies into those zones are still just bounces within a downtrend.

  • Kaspa Price Prediction November 2025: If KAS can keep defending the $0.048–$0.050 base and broader market conditions (especially BTC) remain stable, the most likely path is a relief move back into the $0.060–$0.070 area, where sellers are likely to show up again. According to this Kaspa price prediction, a stronger push with good volume could extend toward $0.075–$0.080, but that would probably require a broader alt-coin tailwind. On the flip side, a clean daily close below $0.048 would shift the bias bearish again and open room toward $0.035–$0.038, with only that October spike low as deeper support. For now, sideways chop between roughly $0.05 and $0.07 looks like the base case until a clear breakout or breakdown confirms the next major leg.

  • Future outlook: Kaspa’s longer-term story is still interesting: a high-throughput proof-of-work blockDAG with very fast confirmations, positioned as a settlement layer rather than a meme narrative. As the ecosystem slowly builds out (with more wallets, bridges, and DeFi primitives) and emissions continue to taper, KAS can stay on the radar of miners and long-term believers in PoW security. From a chart perspective, bulls need to protect the $0.048-0.050 zone and then start reclaiming those overhead bands step-by-step, first $0.06, then $0.075-0.08, and eventually $0.10+, to argue that the post-parabola downtrend is ending. If that base fails or macro pressure increases, the coin likely spends more time grinding lower supports before any new cycle uptrend can begin.

Loading...

Where will Kaspa Price Head Next?

KAS/USD | Source: TradingView
  • Kaspa is hovering just above 0.05, trying to lift off the 0.048-0.050 support band. The 20-day EMA sits just under price near 0.046, and the 50-day, around 0.053, is the first real speed bump.

  • If buyers can push through 0.060-0.062 and hold it, the chart starts to point back toward 0.075-0.080, and later that old trouble zone near 0.095-0.10.

  • RSI is in the mid-50s, which basically says, “uptrend attempt, but not overheated yet” – there’s still room for a push before things look stretched.

  • Lose the 0.048-0.050 shelf, and then 0.046, and the price probably drifts down toward 0.035-0.038, where you’d expect stronger dip-buying interest to show up again.

Indicator Value
Support levels (Fibonacci, S1/S2/S3)
$0.048 / $0.046 / $0.038
Resistance levels (Fibonacci, R1/R2/R3)
$0.060 / $0.075 / $0.095
50-day EMA
$0.053
200-day EMA
$0.075
RSI level
≈ 56
MACD level (Signal Line)
Negative

Kaspa Price Prediction Daily

Over the next day or so, Kaspa probably chops in a narrow 0.048-0.055 band while the market decides what to do next. The key intraday tell is that the 20-day EMA is down near 0.046, and the short-term floor is at 0.048-0.050: as long as price holds above that pocket, bounces can keep grinding higher. A clean daily close over 0.060-0.062 would be the first real sign of strength, putting 0.075-0.080 on the radar and, with strong follow-through, even a look toward 0.095-0.10. On the downside, 0.048 then 0.046 are the first magnets; lose those, and price can drift toward the 0.038-0.035 area where that prior washout low sits and buyers are more likely to step in again.
Disclaimer: KASPA Price predictions are speculative. Markets are volatile, do your own research before investing.

KASPA Price Prediction Weekly

On the weekly chart, Kaspa is still just ranging between the highs of 0.04s and the lows of 0.06s. A strong weekly close above 0.062-0.070 (with real volume) would likely kick it toward 0.075-0.080 and maybe 0.095-0.10 if buyers stay in control. Slip back under ~0.046, and the focus shifts down to 0.038-0.035. For now, the high-0.04s floor is holding, so the bias is slightly up – but it’s still a range until price truly breaks out.

Disclaimer: KASPA Price predictions are speculative. Markets are volatile, do your own research before investing.

KASPA Price Prediction November 2025

November looks like a “show me” month for Kaspa. As long as the price keeps bouncing around the 0.048-0.055 band, expect more back-and-forth while the market reloads. The real confirmation is a solid daily close above 0.060-0.062 – that’s the kind of move that can pull price toward 0.075-0.080. If the 0.048-0.046 area gives way instead, a cool-off toward 0.038-0.035 is on the cards, where stronger hands are more likely to step in again.

KASPA Price Prediction December 2025

In December, Kaspa is still mainly a range trade unless it finally breaks out over that 0.060-0.062 lid. Hold the 0.048-0.050 floor and the tone stays cautiously positive, with any push above 0.062 opening room toward 0.075-0.080 and maybe a brief look at 0.095-0.10 if momentum really clicks. Lose 0.048 and then 0.046, though, and the market probably revisits 0.038-0.035, turning the month into more of a “bottom-fishing” phase than a breakout one.

Kaspa Price Prediction 2025

By 2025, Kaspa price is anticipated to trade in a range of $0.8 to $1. Continued advancements in blockchain technology and decentralized applications (dApps) are expected to bolster Kaspa’s market presence. Technical analysis suggests potential breakout opportunities, with key support and resistance levels guiding investor sentiment. Market dynamics, including regulatory developments and macroeconomic factors, will influence Kaspa price trajectory as it seeks to solidify its position in the digital asset landscape.

Kaspa Price Prediction 2026

Looking ahead to 2026, Kaspa price is predicted to trade within a range of $0.56 to $0.62. As blockchain scalability improves and adoption expands, Kaspa may experience phases of consolidation and incremental growth. Technical indicators highlight crucial resistance levels and support zones, shaping investor strategies amidst market fluctuations. Continued innovation in decentralized finance (DeFi) and strategic partnerships could play a pivotal role in Kaspa price dynamics, reflecting its evolving utility and market integration.

Kaspa Price Prediction 2027

In 2027, Kaspa price is projected to trade between $0.75 and $1.1. Enhanced blockchain interoperability and broader market acceptance are expected to drive Kaspa’s growth trajectory. Technical analysis points to potential bullish trends, supported by strategic ecosystem developments and institutional adoption. Regulatory clarity and global economic trends will likely influence Kaspa price’s market sentiment and price stability, shaping its path towards becoming a prominent player in the digital asset ecosystem.

Kaspa Price Prediction 2028

By 2028, Kaspa price aims to establish a price range of $1.5 to $1.9. Continued advancements in blockchain infrastructure and decentralized applications are anticipated to bolster Kaspa’s market position. Technical indicators suggest potential breakout opportunities, with strategic partnerships and market integration driving investor confidence. Market sentiment and regulatory developments will play a crucial role in shaping Kaspa price trajectory, reflecting its evolving role in the decentralized economy.

Kaspa Price Prediction 2029

Looking towards 2029, Kaspa price is forecasted to trade within a range of $1.2 to $1.7. As blockchain innovation matures and adoption expands, Kaspa may experience periods of volatility amidst growing market integration. Technical analysis highlights critical support and resistance levels, guiding investor decisions amidst evolving market conditions. Regulatory frameworks and macroeconomic factors will likely impact Kaspa price’s market sentiment and price dynamics, reflecting its journey towards broader market acceptance.

Kaspa Price Prediction 2030

In 2030, Kaspa price aims to trade in a range of $2.5 to $2.9. Continued advancements in blockchain scalability and decentralized governance are expected to propel Kaspa’s growth trajectory. Technical indicators suggest potential breakthroughs, driven by strategic partnerships and enhanced market liquidity. Investor sentiment and global economic trends will influence Kaspa’s market dynamics, reflecting its evolving role as a key player in the digital economy.

KASPA (KAS) Price Prediction Table (2025-2030)

Notes: ROI% is calculated against today’s price (~$0.051) using the Avg Price (USD). INR values assume 1 USD = ₹85. These are directional estimates based on the current chart trend, not financial advice.

Year

Min Price (USD)

Min Price (INR)

Avg Price (USD)

Avg Price (INR)

Max Price (USD)

Max Price (INR)

ROI% vs Today (Avg USD)

2025

$0.045

₹4

$0.060

₹5

$0.080

₹7

17.6%

2026

$0.055

₹5

$0.080

₹7

$0.110

₹9

56.9%

2027

$0.070

₹6

$0.110

₹9

$0.150

₹13

115.7%

2028

$0.090

₹8

$0.140

₹12

$0.200

₹17

174.5%

2029

$0.110

₹9

$0.180

₹15

$0.260

₹22

252.9%

2030

$0.130

₹11

$0.220

₹19

$0.320

₹27

331.4%