


This JELLY JELLY Coin price prediction analyzes the token’s short-, medium-, and long-term outlook using technical indicators such as RSI, MACD, moving averages, and support and resistance levels. Explore projected price targets for today, this week, 2026, 2030, and 2040 based on the prevailing market trend and chart analysis.
Jelly-My-Jelly (JELLY JELLY) is currently trading at $0.090064, reflecting a bullish market sentiment as of 15 June 2026. The 14-day RSI stands at 80.85, signaling overbought conditions, while the 50-day and 200-day moving averages are positioned at $0.083465 and $0.077758, respectively. The MACD is positive, indicating bullish short-term momentum. Based on these technical indicators and broader market trends, JELLY JELLY is expected to test resistance near $0.095000 while holding support around $0.085000 in the near term.
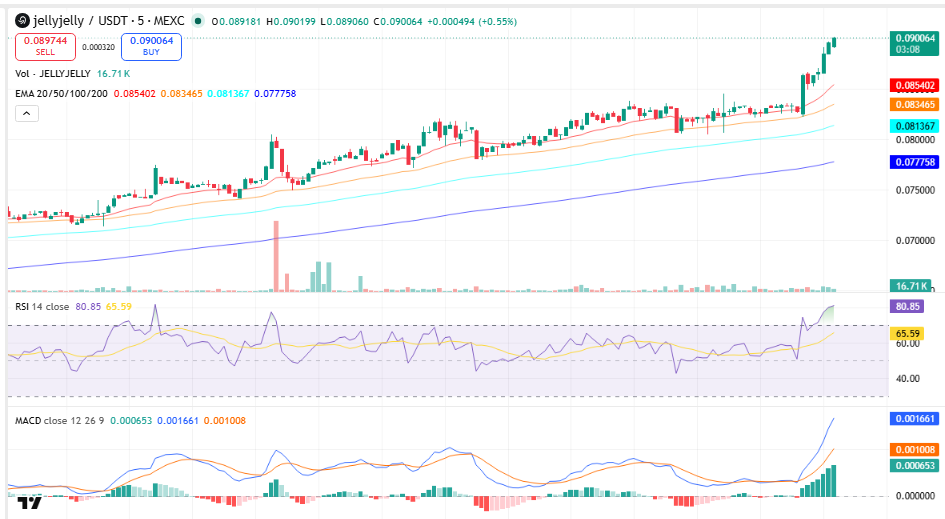
Jelly-My-Jelly/USDT, Source TradingView
Key Insights
- Short-term: JELLY JELLY remains in a strong uptrend and could trade between $0.085000 and $0.095000 over the coming week if buying momentum continues.
- Medium to Long-term: For 2026, price action may remain above the 200-day MA if the trend is sustained, while 2030 depends on broader market cycles and long-term adoption.
- Technical Analysis: RSI at 80.85 indicates overbought conditions, but the positive MACD and price trading above all key moving averages continue to favor buyers.
Jelly-My-Jelly Short-Term Price Prediction – Today, This Week, June 2026
Here is the Jelly-My-Jelly price prediction 2026 for today, this week, and June 2026.
| Timeframe | Price Target | Support | Resistance | ROI |
| Next 24 Hrs | $0.092000 | $0.085402 | $0.092000 | +2.15% |
| This Week | $0.095000 | $0.083465 | $0.095000 | +5.48% |
| June 2026 | $0.098000 | $0.080000 | $0.098000 | +8.81% |
JELLY JELLY Price Prediction Today
Jelly-My-Jelly is trading at $0.090064 and is expected to range between $0.085402 and $0.092000 in the next 24 hours. The RSI sits at 80.85 and the 20-EMA at $0.085402 signals bullish short-term momentum. A hold above $0.085402 targets $0.092000; a break below risks a drop to $0.083465.
JELLY JELLY Price Prediction for This Week
Jelly-My-Jelly is projected to trade between $0.083465 and $0.095000 for the week of 15–21 June 2026. JELLY JELLY is above the 50-day EMA at $0.083465, with the MACD histogram expanding, pointing to bullish momentum. A weekly close above $0.090064 opens $0.095000; a loss of $0.083465 targets $0.080000.
JELLY JELLY Price Prediction for June 2026
Jelly-My-Jelly’s June 2026 price prediction targets $0.098000, with a range of $0.080000–$0.098000. JELLY JELLY is above its 200-day MA at $0.077758, and the monthly RSI at 80.85 signals overbought conditions. A monthly close above $0.090064 would confirm bullish momentum heading into Q2 2026.
Trade JELLYJELLY in INR on ![]()
Deposit and withdraw in INR (₹).
No Conversion to Crypto Required.

JELLY JELLY Price Prediction for July 2026
Jelly-My-Jelly’s July 2026 price prediction targets $0.100000, with a range of $0.085000–$0.100000. JELLY JELLY is above its 200-day MA at $0.077758, and the monthly RSI at 80.85 signals overbought conditions. A monthly close above $0.095000 would confirm bullish momentum heading into Q3 2026.
JELLY JELLY Price Prediction 2026 (Medium Term)
| Month | Price Target | Support | Resistance | ROI |
| June 2026 | $0.098000 | $0.080000 | $0.098000 | +8.81% |
| July 2026 | $0.100000 | $0.085000 | $0.100000 | +11.03% |
| Aug 2026 | $0.102000 | $0.088000 | $0.102000 | +13.25% |
| Sep 2026 | $0.104000 | $0.090000 | $0.104000 | +15.47% |
| Oct 2026 | $0.106000 | $0.092000 | $0.106000 | +17.69% |
| Nov 2026 | $0.108000 | $0.094000 | $0.108000 | +19.91% |
| Dec 2026 | $0.110000 | $0.095000 | $0.110000 | +22.13% |
Jelly-My-Jelly’s 2026 price range is projected at $0.080000–$0.110000. The 200-day MA at $0.077758 is the key bull/bear line—a hold above targets $0.110000, while a break below $0.077758 risks a drop to $0.072000. Weekly MACD is positive and RSI is trending above the midline.
JELLY JELLY Price Prediction 2026 to 2040 (Long Term)
| Year | Price Target | Support | Resistance | ROI |
| 2027 | $0.125000 | $0.100000 | $0.135000 | +38.79% |
| 2028 | $0.155000 | $0.125000 | $0.170000 | +72.09% |
| 2029 | $0.185000 | $0.150000 | $0.200000 | +105.41% |
| 2030 | $0.220000 | $0.180000 | $0.240000 | +144.27% |
| 2031 | $0.250000 | $0.210000 | $0.275000 | +177.57% |
| 2035 | $0.400000 | $0.340000 | $0.450000 | +344.16% |
| 2040 | $0.700000 | $0.600000 | $0.800000 | +677.13% |
Jelly-My-Jelly 2030 Forecast: What Is the Expected Price?
The JELLY JELLY Coin price prediction 2030 targets $0.220000, within a range of $0.180000–$0.240000, supported by the current bullish market structure and sustained buying momentum. If the long-term trend remains intact, continued higher highs and higher lows could drive further appreciation. Technical trend projections support a range of $0.180000–$0.240000 under continued network growth.
Jelly-My-Jelly 2031 Outlook and Expected Price Range
The Jelly-My-Jelly price outlook for 2031 targets $0.250000, with a range of $0.210000–$0.275000, as the market enters the next growth phase following the current bullish cycle. Cycle analysis suggests 2027 may serve as a comparable accumulation year before another expansion. Price action, trading volume, and long-term trend strength will remain the primary indicators to monitor.
Jelly-My-Jelly 2040 Long-Term Forecast
The Jelly-My-Jelly price forecast for 2040 projects an average price of $0.700000, ranging from $0.600000 to $0.800000. Based on the current technical trend and continued market expansion, long-term trend models point toward a range of $0.600000–$0.800000, while aggressive bullish scenarios could extend toward $1.000000. These forecasts carry high uncertainty and should be interpreted as scenario ranges rather than fixed targets.
Jelly-My-Jelly Technical Analysis
The following technical indicators were used to derive the price predictions above. Each indicator’s value and signal should be updated at the time of publishing.
| Indicator | Value | Signal |
| Relative Strength Index (14-Day RSI) | 80.85 | Overbought |
| 50-Day Moving Average | $0.083465 | Bullish |
| 200-Day Moving Average | $0.077758 | Bullish |
| MACD | 0.000653 | Bullish |
| MACD Histogram | 0.001008 | Positive |
| Average Trading Volume (14-Day) | Increasing | Increasing |
Relative Strength Index (RSI)
The 14-day RSI is at 80.85, signaling overbought (>70) conditions. A short-term pullback or consolidation may precede the next leg higher, although the overall trend remains bullish while price continues trading above its key moving averages.
Moving Averages (50-Day & 200-Day MA)
JELLY JELLY is above its 50-day MA at $0.083465 and above its 200-day MA at $0.077758. This reflects a Golden Cross alignment, indicating strong bullish macro momentum and a favorable long-term trend.
MACD (Moving Average Convergence Divergence)
The MACD is above the signal line with a histogram of 0.001008, indicating bullish momentum. The expanding positive histogram supports continued upside as long as buying pressure remains strong.
Volume Analysis
Jelly-My-Jelly’s average daily trading volume is increasing. Rising volume confirms bullish conviction behind the recent breakout and supports trend continuation, although elevated RSI suggests traders should watch for periods of consolidation.
On-Chain Metrics (Bonus Indicator)
Current price action suggests accumulation remains the dominant trend as JELLY JELLY continues trading above its 50-day and 200-day moving averages. Long-term holders appear to be maintaining positions, supporting the broader bullish structure. Overall market sentiment remains positive, although the overbought RSI indicates the possibility of increased short-term volatility.
FAQs
1. Is Jelly-my-Jelly a good investment in 2026?
Jelly-my-Jelly is a Solana-based token connected to the JellyJelly social video platform, which focuses on AI-powered video sharing and creator tools. The project has gained attention through its connection to social media applications and growing community engagement. JELLYJELLY’s market performance remains closely linked to platform adoption, ecosystem development, and overall crypto market conditions.
2. What is the all-time high for Jelly-my-Jelly?
The all-time high price of Jelly-my-Jelly (JELLYJELLY) was approximately $0.49, reached in November 2025 following increased market interest after the token's launch. Since then, the token has traded below its peak value while continuing to remain active within the Solana ecosystem and its associated social media platform.
3. Who is the founder of theJelly-my-Jelly coin?
Jelly-my-Jelly was launched by Sam Lessin, the co-founder of the JellyJelly social video platform and a former Facebook executive. The project was created to support the platform’s AI-powered content ecosystem by combining social media features with blockchain technology and community-driven participation.
Disclaimer: This article is for informational purposes only and does not constitute financial or investment advice. Crypto markets are highly volatile. Always do your own research (DYOR) before making any investment decisions.


