


The Celestia Crypto price prediction indicates a cautious outlook for TIA as bearish momentum and oversold RSI conditions continue to influence price action. Based on technical indicators, TIA could trade between $0.375 and $0.455 in 2026, with potential long-term upside toward $1.20 by 2030. Explore Celestia’s daily, weekly, monthly, and long-term forecasts using RSI, MACD, moving averages, and key support and resistance levels.
Celestia (TIA) is currently trading at $0.3819, reflecting a bearish market sentiment as of 23 June 2026. The 14-day RSI stands at 27.77, signaling oversold conditions, while the 50-day and 200-day moving averages are positioned at $0.3906 and $0.3912, respectively. The MACD is negative, indicating bearish short-term momentum. Based on these technical indicators and broader market trends, TIA is expected to consolidate near $0.38 and attempt a recovery toward the $0.39-$0.40 resistance zone in the near term.
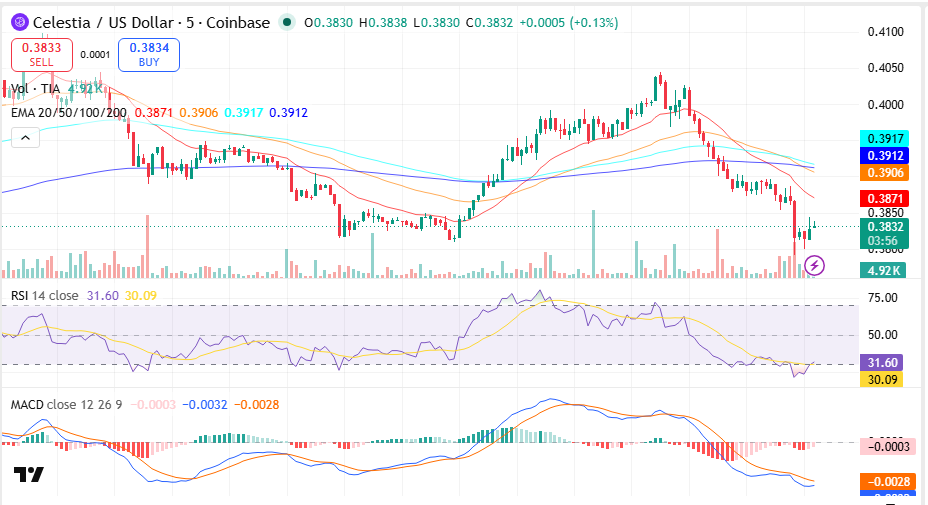
TIA price chat, Source TradingView
Key Insights
● Weekly Outlook: TIA may trade between $0.378 and $0.390 this week as oversold RSI conditions support a short-term relief bounce.
● Monthly & Long-Term Outlook: June and July 2026 targets remain around $0.390-$0.400, while sustained adoption could push TIA toward $0.55-$0.70 by 2030.
● Technical Analysis: TIA trades below its 20, 50, 100, and 200-day moving averages, while RSI at 27.77 and a negative MACD indicate bearish momentum with oversold conditions.
Celestia Short-Term Price Prediction – Today, This Week, June 2026
Here is the Celestia coin price prediction 2026 for today, this week, and June 2026.
| Timeframe | Price Target | Support | Resistance | ROI |
| Next 24 Hrs | $0.3850 | $0.3800 | $0.3870 | +0.81% |
| This Week | $0.3900 | $0.3780 | $0.3912 | +2.12% |
| June 2026 | $0.3950 | $0.3750 | $0.4000 | +3.43% |
Celestia Coin Price Prediction Today
Celestia is trading at $0.3819 and is expected to range between $0.3800 and $0.3870 in the next 24 hours. The RSI sits at 27.77 and the 20-EMA at $0.3869 signals bearish short-term momentum. A hold above $0.3800 targets $0.3870; a break below risks a drop to $0.3750.
Celestia Price Prediction for This Week
Celestia is projected to trade between $0.3780 and $0.3900 for the week of 23-29 June 2026. TIA is below the 50-day EMA at $0.3906, with the MACD histogram contracting in negative territory, pointing to bearish momentum. A weekly close above $0.3912 opens $0.4000; a loss of $0.3780 targets $0.3700.
Celestia Coin Price Prediction for June 2026
Celestia’s June 2026 price prediction targets $0.3950, with a range of $0.3750-$0.4000. TIA is below its 200-day MA at $0.3912, and the monthly RSI at 27.77 signals oversold conditions. A monthly close above $0.4000 would confirm bullish momentum heading into Q3 2026.
Trade TIA in INR on ![]()
Deposit and withdraw in INR (₹).
No Conversion to Crypto Required.

Celestia Price Prediction for July 2026
Celestia’s July 2026 price prediction targets $0.4000, with a range of $0.3800-$0.4050. TIA is below its 200-day MA at $0.3912, and the monthly RSI at 27.77 signals oversold conditions. A monthly close above $0.4050 would confirm bullish momentum heading into Q3 2026.
Celestia Crypto Price Prediction 2026 (Medium Term)
| Month | Price Target | Support | Resistance | ROI |
| June 2026 | $0.3950 | $0.3750 | $0.4000 | +3.43% |
| July 2026 | $0.4000 | $0.3800 | $0.4050 | +4.74% |
| Aug 2026 | $0.4100 | $0.3900 | $0.4150 | +7.36% |
| Sep 2026 | $0.4200 | $0.3950 | $0.4250 | +9.98% |
| Oct 2026 | $0.4300 | $0.4050 | $0.4350 | +12.60% |
| Nov 2026 | $0.4400 | $0.4100 | $0.4450 | +15.22% |
| Dec 2026 | $0.4500 | $0.4200 | $0.4550 | +17.84% |
Celestia’s 2026 price range is projected at $0.3750-$0.4550. The 200-day MA at $0.3912 is the key bull/bear line—a hold above targets $0.4500, while a break below $0.3750 risks a drop to $0.3500. Weekly MACD is negative and RSI is trending below the midline.
Celestia Price Prediction 2026 to 2040 (Long Term)
| Year | Price Target | Support | Resistance | ROI |
| 2027 | $0.55 | $0.40 | $0.60 | +43.98% |
| 2028 | $0.75 | $0.55 | $0.80 | +96.39% |
| 2029 | $0.95 | $0.70 | $1.00 | +148.76% |
| 2030 | $1.20 | $0.90 | $1.30 | +214.22% |
| 2031 | $1.10 | $0.85 | $1.20 | +188.02% |
| 2035 | $1.80 | $1.40 | $2.00 | +371.34% |
| 2040 | $3.00 | $2.20 | $3.50 | +685.55% |
Celestia 2030 Forecast: What Is the Expected Price?
Celestia price prediction 2030 targets $1.20, within a range of $0.90-$1.30, fueled by growing network adoption and increasing demand for modular blockchain infrastructure. Based on the current technical setup and long-term trend extrapolation from the charts, continued ecosystem expansion could support a model range of $0.90-$1.50 under sustained network growth.
Celestia 2031 Outlook and Expected Price Range
The Celestia price outlook for 2031 targets $1.10, with a range of $0.85-$1.20, as the market enters a consolidation phase following the prior expansion cycle. Cycle analysis suggests 2031 may mirror the 2026 pattern—either consolidating from a previous peak or building a new base. Long-term holder activity and exchange reserve trends will be the key signals to monitor.
Celestia Price Prediction 2040: Long-Term Forecast
The Celestia price forecast for 2040 projects an average price of $3.00, ranging from $2.20 to $3.50. Under moderate adoption assumptions and continued growth of modular blockchain applications, long-term valuation models point to a range of $2.20-$3.50, while aggressive scenarios could exceed $5.00. These forecasts carry high uncertainty and should be interpreted as scenario ranges rather than fixed targets.
Celestia Technical Analysis
The following technical indicators were used to derive the price predictions above. Each indicator’s value and signal should be updated at the time of publishing.
| Indicator | Value | Signal |
| Relative Strength Index (14-Day RSI) | 27.77 | Oversold |
| 50-Day Moving Average | $0.3906 | Bearish |
| 200-Day Moving Average | $0.3912 | Bearish |
| MACD | -0.0033 | Bearish |
| MACD Histogram | -0.0004 | Negative |
| Average Trading Volume (14-Day) | $56.45M | Increasing |
Relative Strength Index (RSI)
The 14-day RSI is at 27.77, signaling oversold (<30) conditions. Oversold levels have historically preceded relief rallies, suggesting that selling pressure may be nearing exhaustion and a short-term recovery attempt could emerge if support levels hold.
Moving Averages (50-Day & 200-Day MA)
TIA is below its 50-day MA at $0.3906 and below its 200-day MA at $0.3912. This alignment indicates a sustained downtrend, with the $0.3900-$0.3920 region acting as the key resistance zone that bulls need to reclaim to improve the medium-term outlook.
MACD (Moving Average Convergence Divergence)
The MACD is below the signal line with a histogram of -0.0004, indicating bearish momentum. The bearish crossover and negative histogram suggest growing sell pressure, although the narrowing histogram indicates momentum could stabilize if buyers step in near current levels.
Volume Analysis
Celestia’s average daily trading volume over the past 14 days is approximately $56.45 million. Rising trading activity confirms bearish conviction and the continuation of the current trend. A meaningful increase in buying volume near support would be required to validate a reversal scenario.
Disclaimer: This article is for informational purposes only and does not constitute financial or investment advice. Crypto markets are highly volatile. Always do your own research (DYOR) before making any investment decisions.
FAQs
Will the Celestia price ever hit $100?
Celestia has just begun with its trading journey and is believed to maintain a strong upswing to reach the $100 milestone.
What will Celestia be worth in 2025?
The TIA price may trade between $21.6 and $22.5 in 2025.
What was Celestia’s highest price?
The highest price achieved by Celestia was $11.39 on December 06, 2023.
Is Celestia a safe investment?
TIA has seen fluctuations in both up and down market trends recently. Nevertheless, it's crucial to conduct thorough research on its fundamental aspects and perform a detailed analysis of its price before considering any investment.
What will be the price of 1 TIA in 2030?
The price of 1 TIA may trade between $32 to $33 in 2030.


