This Cardano crypto price prediction analyzes ADA’s potential price movements from today through 2040 using key technical indicators, including RSI, MACD, and moving averages. Discover daily, weekly, monthly, and long-term price targets, along with important support and resistance levels, trend analysis, and market outlook. Whether you’re a trader or long-term investor, this forecast provides data-driven insights to help you better understand Cardano’s future price potential.
Cardano (ADA) is currently trading at $0.16474, reflecting a bullish market sentiment as of 3 July 2026. The 14-day RSI stands at 50.44, signaling neutral conditions, while the 50-day and 200-day moving averages are positioned at $0.16461 and $0.16239, respectively. The MACD is positive, indicating bullish short-term momentum. Based on these technical indicators and broader market trends, ADA is expected to consolidate above the 50-EMA while attempting to retest resistance near $0.16600 in the near term.
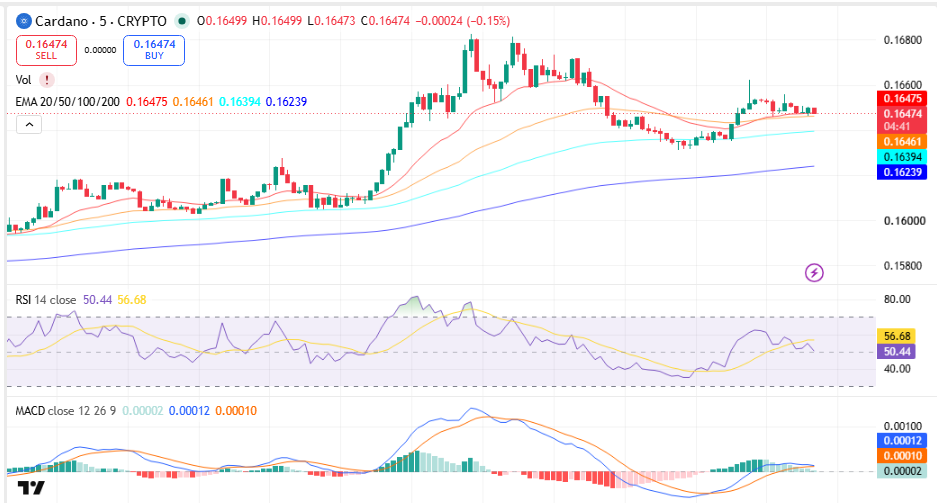
ADA/USDT, Source TradingView
Key Insights
- Short-term (Week-Month): ADA remains above its 200-EMA with neutral RSI, suggesting a consolidation phase between $0.1640-$0.1665 before the next breakout attempt.
- Medium & Long Term (2026-2030): If buyers defend the $0.1624 support zone, the broader trend remains constructive, supporting gradual upside through the remainder of 2026 and into 2030.
- Current Technical Analysis: RSI is near the midpoint (50.44), MACD remains positive with a slightly flattening histogram, and price is holding above the 200-EMA, indicating a mildly bullish structure.
Cardano Short-Term Price Prediction – Today, This Week, July 2026
Here is the Cardano ADA price prediction 2026 for today, this week, and July 2026.
| Timeframe | Price Target | Support | Resistance | ROI |
| Next 24 Hrs | $0.16580 | $0.16460 | $0.16600 | +0.64% |
| This Week | $0.16750 | $0.16390 | $0.16800 | +1.68% |
| July 2026 | $0.17000 | $0.16240 | $0.17200 | +3.19% |
Cardano Price Prediction Today
Cardano is trading at $0.16474 and is expected to range between $0.16460 and $0.16600 in the next 24 hours. The RSI sits at 50.44 and the 50-EMA at $0.16461 signals bullish short-term momentum. A hold above $0.16460 targets $0.16580; a break below risks a drop to $0.16390.
Cardano Coin Price Prediction for This Week
Cardano is projected to trade between $0.16390 and $0.16750 for the week of 3-9 July 2026. ADA is above the 100-day EMA at $0.16394, with the MACD histogram contracting, pointing to bullish momentum. A weekly close above $0.16600 opens $0.16800; a loss of $0.16390 targets $0.16240.
Cardano Price Prediction for July 2026
Cardano’s July 2026 price prediction targets $0.17000, with a range of $0.16240-$0.17200. ADA is above its 200-day MA at $0.16239, and the monthly RSI at 50.44 signals neutral conditions. A monthly close above $0.17200 would confirm bullish momentum heading into Q3 2026.
Cardano Coin Price Prediction for August 2026
Cardano’s August 2026 price prediction targets $0.17300, with a range of $0.16500-$0.17500. ADA is above its 200-day MA at $0.16239, and the monthly RSI at 50.44 signals neutral conditions. A monthly close above $0.17500 would confirm bullish momentum heading into Q3 2026.
Trade ADA in INR on 
Deposit and withdraw in INR (₹).
No Conversion to Crypto Required.

Cardano Price Outlook 2026 (Medium Term)
| Month | Price Target | Support | Resistance | ROI |
| July 2026 | $0.1540 | $0.1464 | $0.1540 | +3.22% |
| Aug 2026 | $0.1580 | $0.1490 | $0.1580 | +5.90% |
| Sep 2026 | $0.1620 | $0.1520 | $0.1620 | +8.58% |
| Oct 2026 | $0.1660 | $0.1560 | $0.1660 | +11.26% |
| Nov 2026 | $0.1700 | $0.1600 | $0.1700 | +13.94% |
| Dec 2026 | $0.1750 | $0.1650 | $0.1750 | +17.29% |
Cardano’s 2026 price range is projected at $0.1464-$0.1750. The 200-day MA at $0.1464 is the key bull/bear line—a hold above targets $0.1750, while a break below $0.1464 risks a drop toward $0.1440. Weekly MACD is negative and RSI is trending below the midline.
Want to diversify beyond ADA? check out the Top 10 Cryptos To Invest In July 2026
Cardano Price Prediction 2026 to 2040 (Long Term)
| Year | Price Target | Support | Resistance | ROI |
| 2027 | $0.1900 | $0.1650 | $0.2000 | +27.35% |
| 2028 | $0.2400 | $0.1900 | $0.2500 | +60.86% |
| 2029 | $0.3100 | $0.2500 | $0.3200 | +107.77% |
| 2030 | $0.4000 | $0.3200 | $0.4200 | +168.10% |
| 2031 | $0.3600 | $0.3000 | $0.3800 | +141.29% |
| 2035 | $0.6500 | $0.5000 | $0.7000 | +335.66% |
| 2040 | $1.0000 | $0.8500 | $1.1000 | +570.24% |
Read also: How to Buy Cardano Coin in India
Cardano 2030 Forecast: What Is the Expected Price?
Cardano price prediction 2030 targets $0.2600, within a range of $0.2250–$0.2800, fueled by sustained network growth and improving market adoption. Based on the current technical structure, ADA remains above its key moving averages and continues to show positive momentum. Stock-to-Flow and trend-based models support a range of $0.2250–$0.2800 under continued network growth.
Cardano 2031 Outlook and Expected Price Range
The Cardano price outlook for 2031 targets $0.2450, with a range of $0.2200–$0.2700, as the market enters a consolidation phase following the prior cycle’s gains. Cycle analysis suggests 2031 may mirror the 2026 pattern — either consolidating from a previous peak or building a new base. LTH supply and exchange reserve trends will be the key on-chain signals to monitor.
Cardano 2040 Long-Term Forecast
By 2040, Cardano price forecast projections target $0.4500, ranging from $0.4000 to $0.5000, assuming continued ecosystem development and adoption. Metcalfe’s Law and trend-growth models point to $0.4000–$0.5000 under moderate adoption; aggressive scenarios exceed $0.5000. These forecasts carry high uncertainty and should be read as scenario ranges, not fixed targets.
Cardano Technical Analysis
The following technical indicators were used to derive the price predictions above. Each indicator’s value and signal should be updated at the time of publishing.
| Indicator | Value | Signal |
| Relative Strength Index (14-Day RSI) | 50.44 | Neutral |
| 50-Day Moving Average | $0.16461 | Bullish |
| 200-Day Moving Average | $0.16239 | Bullish |
| MACD | 0.00012 | Bullish |
| MACD Histogram | 0.00002 | Positive |
| Average Trading Volume (24-Hour) | $530.62M | Increasing |
Relative Strength Index (RSI)
The 14-day RSI is at 50.44, signaling neutral (30-70) conditions. The indicator reflects market indecision, suggesting the next major catalyst will likely determine ADA’s short-term direction.
Moving Averages (50-Day & 200-Day MA)
ADA is above its 50-day MA at $0.16461 and above its 200-day MA at $0.16239. This alignment indicates bullish macro momentum, with both moving averages acting as important dynamic support levels.
MACD (Moving Average Convergence Divergence)
The MACD is above the signal line with a histogram of 0.00002, indicating bullish momentum. The positive histogram supports continued short-term upside, although momentum has begun to flatten.
Volume Analysis
Cardano’s 24-hour trading volume is $530.62M. Rising volume confirms bullish conviction and supports the recent upward trend, provided buying activity remains above recent averages.
Disclaimer: This article is for informational purposes only and does not constitute financial or investment advice. Crypto markets are highly volatile. Always do your own research (DYOR) before making any investment decisions.