
Key Takeaways
- ai16z Current Status: Trading at Loading…, the token has experienced a 22.4% gain in the past week, reflecting increasing buyer interest. The Fear-Greed Index at 78 signals market optimism, while the 16/30 green days indicate a favorable trend. A 24-hour trading volume of $386 million underscores robust activity in the market.
- Market Performance: ai16z has a market cap of $2.3 billion, ranking it as a significant player in the crypto market. It remains highly volatile, with a 50.9% volatility index, offering opportunities for both short-term traders and long-term investors. With 53% of its recent days in the green, ai16z continues to exhibit a steady upward trend.
- Technical Analysis: ai16z is trading near the R2 Fibonacci pivot level ($2.5), with resistance expected at $2.9 and support between $1.25-$1.5. The Relative Strength Index (RSI) at 69.3 suggests bullish conditions, with slight cautioning traders against potential pullbacks. Momentum indicators like MACD remain bullish, with a signal line at 0.08, hinting at continued upward pressure.
- ai16z Price Predictions: In January 2025, ai16z is predicted to trade between $2.5 and $3.1, supported by bullish sentiment and Fibonacci levels.Prices could rise to $50-$65 by 2030, driven by market maturity, robust fundamentals, and ecosystem growth. Key levels like $25-$32 (2028) and $35-$42 (2029) suggest incremental gains as the market consolidates.
- Future Outlook: As ai16z approaches its ATH, broader market bullishness could help sustain its momentum. Ecosystem expansion and increasing utility will play a pivotal role in driving future price appreciation.
Where will ai16z Price Head Next?
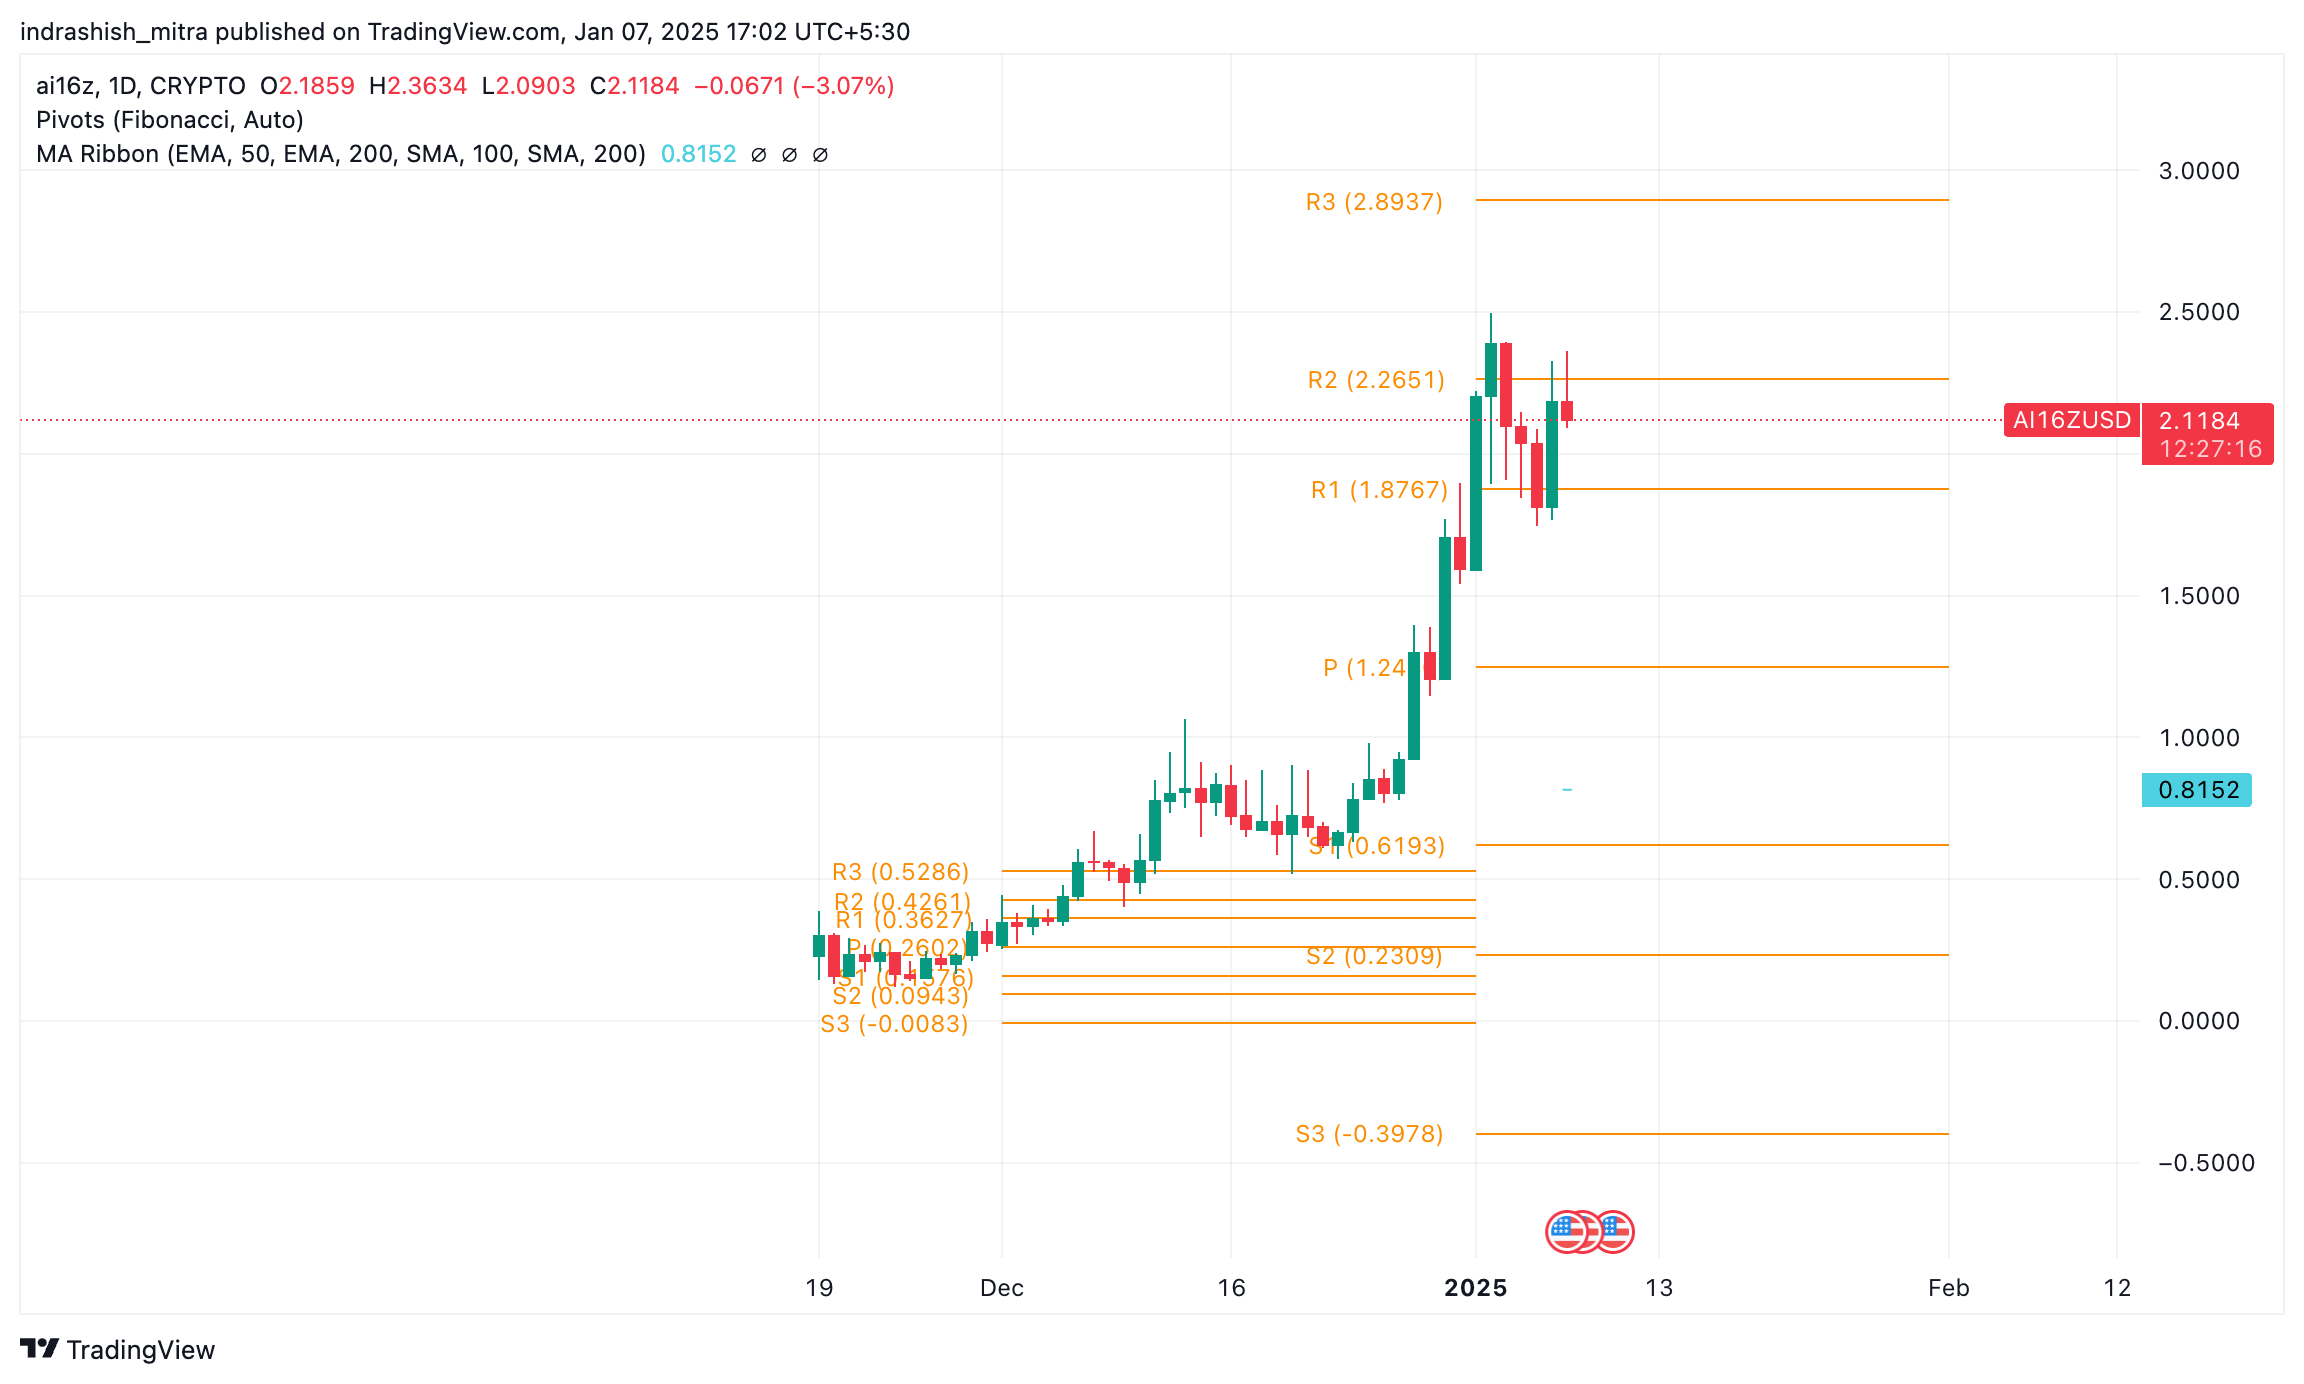
- ai16z price is trading just below its all-time high of $2.5, which also aligns closely with the R2 Fibonacci pivot level for January 2025.
- The RSI is currently at 69.3, indicating that ai16z price is approaching overbought territory. A further increase could signal bullish momentum but also risks short-term corrections.
- The $1.25 to $1.5 region is expected to act as a strong support zone for ai16z price. The $1.25 level is the base Fibonacci pivot for January 2025, while $1.5 holds psychological significance.
- Sustained bullish sentiment in the broader crypto market could propel the price above the $2.5 all-time high, opening doors for new highs before the end of January for ai16z price.
- Traders should monitor volume spikes and broader market trends to confirm breakout potential or identify potential pullbacks near critical levels.
| Indicator | Value |
|---|---|
|
Support levels (Fibonacci, S1/S2/S3)
|
$0.62 / $0.23
|
|
Resistance levels (Fibonacci, R1/R2/R3) |
$1.8 / $2.2 / $2.9
|
|
50-day EMA |
NA |
|
200-day EMA |
NA |
|
RSI level |
69.3 |
|
MACD level (Signal Line) |
0.08 |
ai16z Price Prediction January 2025
In January 2025, the ai16z price is forecasted to trade between $2.5 and $3.1, reflecting a gradual upward momentum in line with its previous trendlines. Technical indicators such as the Relative Strength Index (RSI) suggest that the token is likely to remain within neutral to slightly overbought territory, indicating consistent buyer interest. The 50-day Exponential Moving Average (EMA) is expected to act as a dynamic support, while resistance could emerge near the $3.1 mark, a key psychological barrier. A breakout above this level could signal a shift in sentiment, potentially opening the path for further gains. Traders should watch for volume spikes, as they could validate any price breakout or retracement.
ai16z Price Prediction 2025
By the end of 2025, ai16z price is predicted to trade in the range of $5 to $7.5, driven by anticipated ecosystem developments and expanding investor interest. The Fibonacci retracement tool highlights the $6.5 mark as a potential mid-point resistance level, aligning with historical pivot zones. Momentum indicators, such as the MACD, may exhibit bullish crossovers, underscoring sustained upward pressure. On the downside, the 200-day Simple Moving Average (SMA) is expected to serve as a robust support level. Market sentiment and macroeconomic conditions will also likely influence price action, so traders should remain vigilant for sudden shifts.
In 2026, ai16z price range is forecasted to expand to $12 to $16, supported by its growing adoption and utility. Bollinger Bands suggest heightened volatility during this period, with price action likely testing the upper band near $16. Institutional accumulation may play a pivotal role, as on-chain metrics such as rising wallet activity could signal growing interest. The Ichimoku Cloud further reinforces a bullish outlook, with a strong upward kumo breakout confirming trend continuation. Key support is expected near $12, a previously significant level during earlier consolidations.
For 2027, ai16z price could achieve a price range of $18 to $24, reflecting long-term strength. The token may form ascending channels, supported by increasing market capitalization. The Average Directional Index (ADX) suggests strong trend strength, particularly if the value exceeds 25. Meanwhile, the Chaikin Money Flow (CMF) could confirm sustained capital inflow, validating the bullish trajectory. A close above $20 on the weekly timeframe may signify a breakout toward $24, while a breakdown could retest $18 as a base.
The ai16x price prediction for 2028 is between $25 and $32, a level that reflects a maturing market position. Advanced technicals, including Elliott Wave Theory, suggest this period could represent a fifth-wave impulse, characterized by accelerated gains. Volume profiles indicate strong demand zones near $25, while resistance clusters at $30 to $32 might challenge further growth. The stochastic RSI entering overbought zones would warrant caution, hinting at potential corrections. Traders should also keep an eye on divergence patterns, which might indicate trend exhaustion.
In 2029, ai16z price could climb to a range of $35 to $42, as the project potentially solidifies its role in the blockchain ecosystem. Moving Average Convergence Divergence (MACD) signals could play a significant role, with bullish histograms reinforcing an uptrend. Historical price action reveals a potential breakout point near $38, aligning with Fibonacci extensions. Any downside corrections could be cushioned by the 100-day SMA near $35. The year might also see increased network activity, reflected in rising trading volumes.
By 2030, ai16z price is predicted to reach between $50 and $65, representing exponential growth from earlier years. The token’s trajectory may follow a parabolic curve, often seen during mature bull cycles. The Average True Range (ATR) suggests potential for sharp price movements, while candlestick patterns like bullish engulfing or three white soldiers could validate upward trends. Analysts anticipate that breaking through $60 might trigger new all-time highs, driven by market speculation and robust utility.
Will ai16z Price Continue to Rise in 2025?
The probability of ai16z price continuing its upward trend in 2025 appears high, supported by strong fundamentals and technical indicators. As the token surpasses key resistance levels, the ongoing bullish structure is likely to persist. Tools such as the Parabolic SAR indicate trend continuation, with dots staying below the price line. Additionally, increased network participation and ecosystem expansions could further fuel price momentum. However, factors such as market sentiment, macroeconomic events, and regulatory shifts could influence short-term price direction. Traders are advised to monitor support levels and RSI values for overbought conditions to avoid unexpected corrections.
