
Shiba INU (SHIB) is trading near $0.00000469, with neutral momentum indicated by an RSI of 52. This guide covers SHIB price forecasts for today, this week, August 2026, and long-term projections through 2040 based on key technical indicators and chart trends. The Shiba INU future price prediction highlights crucial support and resistance levels, helping traders assess potential breakout and consolidation scenarios in the evolving market.
At present, the price of Shiba Inu (SHIB) is $0.00000450, down around 0.2% on the day and roughly 9% across the past week as of 11 August 2026. The 14-day RSI reads 45.46 and sits below its 54.31 signal line, which points to momentum that has rolled over rather than collapsed. Price trades 3.02% under the 20-day EMA at $0.00000464 and 3.23% under the 50-day EMA at $0.00000465, and those two averages have now converged to within a single tick. Reclaiming that cluster is the first requirement before any move toward $0.00000495 becomes credible, and failure keeps SHIB pinned between $0.00000440 and $0.00000465.
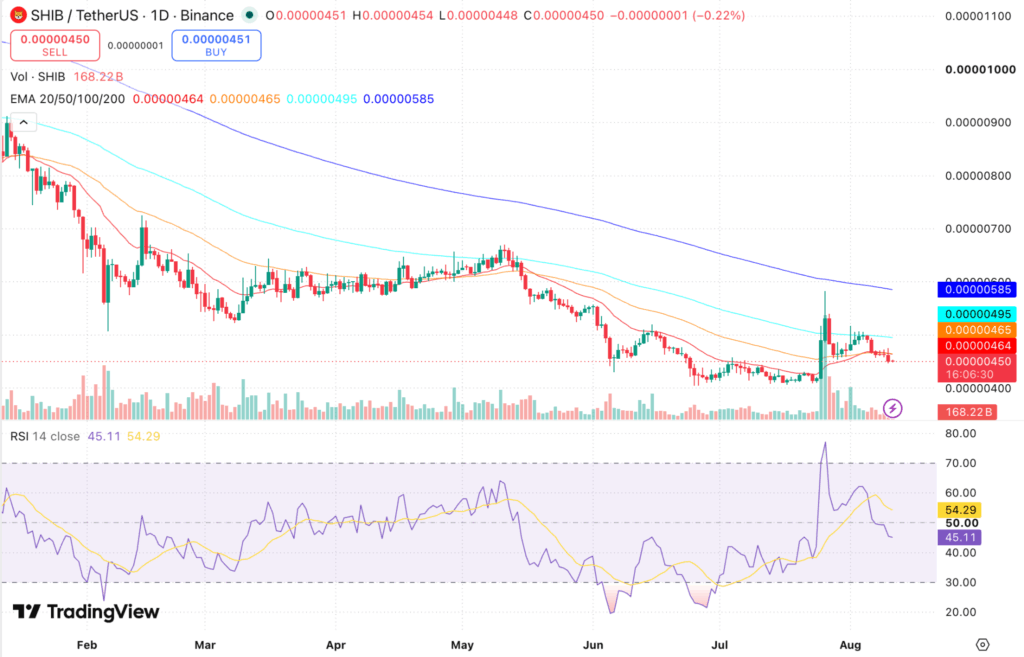
SHIB/USD daily chart. Source: TradingView
Key Insights
- Today: SHIB trades at $0.00000450, below both the 20-EMA at $0.00000464 and the 50-EMA at $0.00000465, which have converged into a single resistance shelf.
- August 2026: A daily close above $0.00000465 opens the path to the 100-EMA at $0.00000495, while rejection there keeps the token boxed between $0.00000440 and $0.00000465.
- Technical Analysis: RSI at 45.46 has crossed under its signal line and the MACD histogram has flipped negative at -0.00000004, confirming that short-term momentum turned well before price approached the 200-EMA at $0.00000585.
SHIB Price Prediction 2026: Short-Term Targets for Today, This Week and August
Here is the Shiba Inu coin price prediction for today, this week and the remainder of August 2026, with each level read directly off the daily chart.
| Timeframe | Price Target | Support | Resistance | ROI |
|---|---|---|---|---|
| Next 24 Hrs | $0.00000464 | $0.00000448 | $0.00000465 | +3.11% |
| This Week | $0.00000480 | $0.00000440 | $0.00000495 | +6.67% |
| Aug 2026 | $0.00000495 | $0.00000430 | $0.00000516 | +10.00% |
Don't miss the next move buy Shiba Inu (SHIB) here
Shiba INU Price Prediction Today
Shiba Inu is trading at $0.00000450 and is likely to hold a $0.00000448 to $0.00000465 band over the next 24 hours. Today’s candle has printed a high of $0.00000454 against a low of $0.00000448, one of the tightest daily ranges of the month. The 20-EMA at $0.00000464 caps the upside, and an RSI of 45.46 sitting under its signal line argues against a clean break on the first attempt. A close back above $0.00000464 would put $0.00000480 in play, while losing $0.00000448 exposes $0.00000440.
Trade SHIB in INR on 
Deposit and withdraw in INR (₹).
No Conversion to Crypto Required.

Shiba Inu Price Prediction This Week:
Shiba Inu is projected to trade between $0.00000440 and $0.00000480 for the week of 10 to 16 August 2026. SHIB is below the 50-day EMA at $0.00000465, and the MACD histogram has turned negative at -0.00000004 after the MACD line at 0.00000003 crossed under its 0.00000008 signal. That crossover occurred while both lines were still above zero, which usually marks a pause in an existing move rather than the start of a fresh downtrend. A weekly close above $0.00000465 opens $0.00000495, while a loss of $0.00000440 targets $0.00000420.
Shiba Inu Price Prediction for August 2026
Shiba Inu’s August 2026 price prediction targets $0.00000495, with a working range of $0.00000430 to $0.00000516. The 100-day EMA sits at $0.00000495 and the month’s high at $0.00000516 marks the ceiling left behind by the 1 August spike. SHIB remains 23.08% below its 200-day EMA at $0.00000585, so August reads as a base-building month rather than a trend reversal. A monthly close above $0.00000495 would be the first credible sign that sellers are losing control of the range.
SHIB Price Prediction for September 2026
Shiba Inu’s September 2026 price prediction targets $0.00000510, with a range of $0.00000450 to $0.00000530. The August high near $0.00000516 becomes the pivot, and holding above it would leave the 200-day EMA as the next meaningful obstacle. Daily turnover has been running near $65 million across major data aggregators, which is thin for a token of this market capitalisation. Without a sustained pickup in that figure, any push toward $0.00000530 is likely to fade.
SHIB Price Prediction 2026: Medium-Term Targets Through December
| Month | Price Target | Support | Resistance | ROI |
|---|---|---|---|---|
| Aug 2026 | $0.00000495 | $0.00000430 | $0.00000516 | +10.00% |
| Sep 2026 | $0.00000510 | $0.00000450 | $0.00000530 | +13.33% |
| Oct 2026 | $0.00000525 | $0.00000465 | $0.00000550 | +16.67% |
| Nov 2026 | $0.00000545 | $0.00000480 | $0.00000570 | +21.11% |
| Dec 2026 | $0.00000565 | $0.00000495 | $0.00000590 | +25.56% |
Shiba Inu’s 2026 price range is projected at $0.00000430 to $0.00000590. The 100-day EMA at $0.00000495 is the practical bull and bear line for the rest of the year, because the 200-day EMA at $0.00000585 sits far enough above that spot that reclaiming it would take a 30% move. A hold above $0.00000495 keeps the December target of $0.00000565 within reach, while a break below $0.00000430 puts the June low at $0.00000405 back in focus. Weekly MACD is negative and RSI remains below its midline.
SHIB Price in INR
Indian traders pricing SHIB in rupees convert at a USD/INR rate of roughly ₹95.25 as of 11 August 2026. Because SHIB quotes to eight decimal places, small dollar moves translate into visible swings in the rupee figure, and the exchange rate itself becomes a second variable in the return. The table below converts the current price and the forward targets at today’s rate.
| Timeframe | Price Target (USD) | Price Target (INR) |
|---|---|---|
| Current Price | $0.00000450 | ₹0.000429 |
| Aug 2026 | $0.00000495 | ₹0.000471 |
| Sep 2026 | $0.00000510 | ₹0.000486 |
| Oct 2026 | $0.00000525 | ₹0.000500 |
| Nov 2026 | $0.00000545 | ₹0.000519 |
| Dec 2026 | $0.00000565 | ₹0.000538 |
| 2030 | $0.00000880 | ₹0.000838 |
| 2040 | $0.00002000 | ₹0.001905 |
Rupee figures move with the exchange rate as well as the token price, so treat them as indicative rather than fixed. A flat dollar move can still register as a gain or a loss once it is converted into INR.
Shiba Inu Price Prediction 2027 to 2040: Long-Term Outlook
| Year | Price Target | Support | Resistance | ROI |
|---|---|---|---|---|
| 2027 | $0.00000580 | $0.00000520 | $0.00000640 | +28.89% |
| 2028 | $0.00000660 | $0.00000580 | $0.00000720 | +46.67% |
| 2029 | $0.00000760 | $0.00000680 | $0.00000840 | +68.89% |
| 2030 | $0.00000880 | $0.00000780 | $0.00000980 | +95.56% |
| 2031 | $0.00000950 | $0.00000840 | $0.00001060 | +111.11% |
| 2035 | $0.00001350 | $0.00001200 | $0.00001500 | +200.00% |
| 2040 | $0.00002000 | $0.00001800 | $0.00002250 | +344.44% |
Shiba Inu 2030 Forecast: What Is the Expected Price?
Shiba Inu price prediction 2030 targets $0.00000880, within a range of $0.00000780 to $0.00000980, supported by continued ecosystem growth and improving crypto market sentiment. Based on long-term trend projections and adoption assumptions, price models suggest a potential range of $0.00000750 to $0.00001000 under sustained network expansion. While these projections remain optimistic, investors should note that long-term forecasts are highly dependent on overall market cycles and adoption trends.
Shiba Inu 2031 Outlook and Expected Price Range
The Shiba Inu price outlook for 2031 targets $0.00000950, with a range of $0.00000840 to $0.00001060, as the market moves into the next expansion phase following the previous cycle. Historical cycle analysis suggests 2031 could represent either a consolidation period after 2030 gains or the foundation for another long-term rally. Exchange flows, holder accumulation and broader crypto sentiment will remain the primary indicators to monitor.
Shiba Inu Price Prediction 2040: Long-Term Forecast
The Shiba Inu price forecast for 2040 projects an average value of $0.00002000, with a potential range between $0.00001800 and $0.00002250. Long-term valuation models indicate a probable range of $0.00001800 to $0.00002250 under moderate adoption, while strong ecosystem growth and continued token utility could push prices toward $0.00002500. These estimates should be viewed as long-term scenarios rather than guaranteed outcomes.
SHIB Burns and Shibarium Activity
SHIB token burns permanently remove SHIB from circulation by sending it to wallets that nobody controls, and this is the mechanism the community relies on to work against a supply of roughly 589 trillion tokens. Cumulatively, about 410.84 trillion SHIB has been burned across more than 21,500 transactions, close to 41% of the original one quadrillion supply. The current pace tells a very different story from that headline number. Burns over the latest 24-hour period came to 4.72 million SHIB worth around $22, a 55% decline on the day before, and an earlier August reading was smaller still at roughly $33 worth. July closed with more than 3.2 billion SHIB burned, the strongest month in some time, which frames the August slowdown as a reversion rather than a new trend.
Shibarium, the Shiba Inu Layer-2 network, processed 4,480 transactions on 9 August, a one-month high and a 507% jump from the 738 recorded the previous day. That figure still sits below the 5,170 transactions logged on 10 July, and daily activity had been running under 1,000 for several consecutive sessions at the start of the month. Because Shibarium burns are funded by transaction fees, a single strong day does not shift the supply picture in any measurable way. Sustained throughput above 5,000 transactions per day is the threshold worth watching before burns become a genuine input to the SHIB price.
SHIB Price Analysis
The below technical indicators below were read from the daily SHIB chart form the basis for every target above.
| Indicator | Value | Signal |
|---|---|---|
| Relative Strength Index (14-Day RSI) | 45.46 | Below signal line |
| 20-Day EMA | $0.00000464 | Bearish |
| 50-Day EMA | $0.00000465 | Bearish |
| 100-Day EMA | $0.00000495 | Bearish |
| 200-Day EMA | $0.00000585 | Bearish |
| MACD Line | 0.00000003 | Bearish crossover |
| MACD Histogram | -0.00000004 | Negative |
| 24-Hour Trading Volume | $65.49M | Subdued |
Relative Strength Index (RSI)
The 14-day RSI is at 45.46 and has crossed below its 54.31 signal line. That sits under the neutral 50 mark but stays well clear of the oversold threshold at 30, which leaves room for further downside before the indicator flags exhaustion. RSI peaked above 78 during the late-July spike and has fallen steadily since, so the current reading reflects momentum unwinding from a stretched level rather than a fresh breakdown.
Moving Averages (20, 50, 100 and 200-Day EMA)
SHIB trades below all four daily EMAs. The 20-EMA at $0.00000464 and the 50-EMA at $0.00000465 have converged to within a single tick, a compression that usually resolves directionally rather than drifting sideways. Price sits 9.09% below the 100-EMA at $0.00000495 and 23.08% below the 200-EMA at $0.00000585, and that last gap is the clearest measure of how much work a genuine trend reversal would require.
MACD
The MACD line at 0.00000003 has crossed under its signal line at 0.00000008, pushing the histogram to -0.00000004. Both lines remain above zero, so this is a bearish crossover inside positive territory rather than a full momentum reversal. If the histogram contracts back toward zero over the next few sessions while price holds $0.00000440, the crossover reads as a pause in the late-July recovery instead of a continuation lower.
Volume Analysis
Daily trading volume across major data aggregators clusters around $65.49 million, taken as the median of readings that ranged from roughly $63 million to $127 million. Set against a market capitalization near $2.65 billion, that turnover is modest and consistent with a market in consolidation rather than one preparing to trend. Today’s daily candle is still open at the time of writing, so its volume bar should not be compared against completed sessions.
What This Means for Indian Traders
For traders in India, the practical read is that SHIB is in a defined range rather than a trend, with $0.00000440 and $0.00000465 marking the edges. Returns in rupee terms depend on the USD/INR rate as well as the token price, so a flat dollar move can still show up as a gain or a loss in INR. Gains on virtual digital assets in India are also taxed at a flat rate with TDS applied on transfers, which makes frequent trading inside a narrow range expensive relative to the size of the moves on offer.
FAQs
Will the Shiba Inu price ever hit $1?
Shiba Inu is believed to maintain an elevated trend in the coming days. However, reaching $1 appears to be extremely difficult, but if the market trend is in favor of bulls, achieving a new milestone could not be a tedious job
What will Shiba Inu be worth in 2025?
The SHIB price may trade between $0.000075 to $0.000092 in 2025.
What will be the price of 1 SHIB in 2030?
The price of 1 SHIB may trade between $790 and $850 in 2030.
Is Shiba Inu a safe investment?
Shiba Inu has been one of the popular tokens since its inception. However, detailed research and price analysis movement are imperative before any investment.
What was Shiba Inu’s highest price?
The highest price achieved by Shiba Inu was $0.00008845 on October 28, 2021.
Disclaimer: This article is for informational purposes only and does not constitute financial or investment advice. Crypto markets are highly volatile. Always do your own research (DYOR) before making any investment decisions.