


Solana projects are gaining serious traction in 2025, from DeFi and NFTs to real-world assets. With Invesco and Galaxy filing a Solana ETF trust, institutional interest is rising, putting top Solana ecosystem tokens in the spotlight alongside BTC and ETH. Let’s delve deeper into some of the top Solana projects in 2025.
Solana ETFs on the Horizon
As the United States approaches the introduction of crypto ETFs, interest in top Solana ecosystem tokens is increasing. In a significant move, digital asset management 3iQ has applied to list The Solana Fund (QSOL), a Solana (SOL) exchange-traded fund, on Canada’s Toronto Stock Exchange.
It will be North America’s first Solana ETP if approved, providing exposure to the SOL price and staking dividends of 6-8%. With Coinbase Custody and Tetra Trust as custodians and institutional staking through Coinbase, this indicates increased institutional interest, cementing Solana’s place as a popular blockchain ecosystem in 2025.
Building on the same wavelength, REX Shares and Osprey Funds also debuted the REX Osprey Solana + Staking ETF (SSK) on Cboe BZX Exchange in the United States. The fund not only holds SOL tokens but also provides staking rewards of approximately 7.3% per year. SSK, with Anchorage Digital as the custodian and the staking partner, has enjoyed robust early demand, surpassing $41 million in assets in just a few days. This action is like a ray of light that illuminates the rising Solana-backed investor interest in the market and thus further facilitates access to the staking yields for the mainstream investors.
Solana
The Solana ecosystem is led by its native token, Solana (SOL), which serves as the network’s backbone. SOL, known for its lightning-fast speeds and minimal fees, powers everything from DeFi to blockchain-based NFTs. Solana, dubbed the “Ethereum killer”, can handle thousands of transactions per second because of its innovative Proof of History (PoH) methodology. This invention offers fast, safe, and scalable transactions, appealing to developers and projects alike. With its rising value in decentralised apps (dApps), staking, and governance, SOL continues to propel the network forward and is a top crypto asset in 2025.
Solana Technical Overview – 2025
| Indicator | Value |
| Support levels (Fibonacci, S1/S2/S3) | $150.81 / $151.70 / $153.82 |
| Resistance levels | $158.88 / $159.72 |
| Total Supply | 604.88M SOL |
| Supertrend (10,3) | $159.72 |
| Vol(24H) | $4.88B |
| RSI level | 50 |
| Founder | Anatoly Yakovenko |

Source: TradingView
Solana is currently experiencing a small comeback following previous pullbacks. With a Relative Strength Index (RSI) of ~50, SOL is gaining strength, indicating the possibility of a rebound if buying pressure rises. RRSI is recovering from neutral levels; short-term consolidation or a bounce is probable. Look for a breakout above $159 to validate the bullish trend. A decline below $149 may open the door to more losses.
As of mid-July 2025, SOL is trading around $158.70, with a market capitalization of $77.58 billion and a 24-hour trading volume of $4.32 billion. If bullish sentiment persists and ETF permits are granted in the United States or Canada, SOL might reach $180-$220 by the end of 2025, particularly as the overall crypto market recovers.
Read More: Top 10 Cryptos in 2024
Chainlink
Chainlink is an essential component in the Solana ecosystem, ranking as the second-largest coin by market capitalization within this growing network. Chainlink, a leading oracle token, plays a crucial role in bridging the gap between blockchain smart contracts and real-world data. This connection is necessary for providing accurate, secure, and real-time information among decentralized apps (dApps).
Chainlink on Solana boosts the potential of DeFi, lending platforms, and prediction markets by providing verifiable off-chain data. Its seamless connection contributes to the reliability and performance of smart contracts, making it a driving force behind Solana’s expanding ecosystem.
Chainlink Technical Overview – 2025
| Indicator | Value |
| Support levels (Fibonacci, S1/S2/S3) | $14.207 / $14.022 / $13.801 |
| Resistance levels | $14.477 / $14.50 |
| EMA 20 / 50 / 100 / 200 | $14.340 / $14.207 / $14.022 / $13.801 |
| Supertrend (10,3) | $14.168 (Bullish) |
| Volume (24H) | $542.90M |
| RSI level | 55.6 |

Source: TradingView
Chainlink is showing signs of consolidation as it trades near critical technical levels. The Relative Strength Index (RSI) of ~55 indicates that the crypto is in neutral territory, implying that it could bounce higher if buying pressure returns. The MACD level of slightly positive, which is above or near the signal line, indicating growing bullish momentum; however, it is not far from a potential crossing that could signal a minor pullback.
Chainlink is in a growing mode. If it continues to trade above support, it is likely to test the $14.88 resistance level. However, a drop below $13.80 might propel it to deeper support levels.
Additional Read: Top Altcoins 2024
Render
Render Token (RNDR) has emerged as a notable AI-driven initiative in the Solana ecosystem, revolutionizing digital content creation through decentralized GPU rendering. At its core, Render Token connects artists, developers, and creators to idle GPU power from individuals worldwide, forming a robust, distributed cloud rendering network.
Render utilizes blockchain and AI technology to accelerate, secure, and lower the cost of rendering complex 2D and 3D models. Whether it’s for gaming, animation, virtual reality, or AI-generated images, RNDR provides the tools creators require while rewarding individuals who donate their underutilised GPU power. Innovation drives the future of digital content.
Render Technical Overview – 2025
| Current Price | $3.47 |
| Market Cap | $1.78B |
| Support levels (Fibonacci, S1/S2/S3) | $3.403 / $3.343 / $3.289 |
| Supertrend (10,3) | $3.383 |
| Resistance levels | $3.464 / $3.50 |
| Circulating Supply | 518.89M |
| Max Supply | 644.16M |
| Vol(24H) | $84.77M |
| Founder | Jules Urbach |
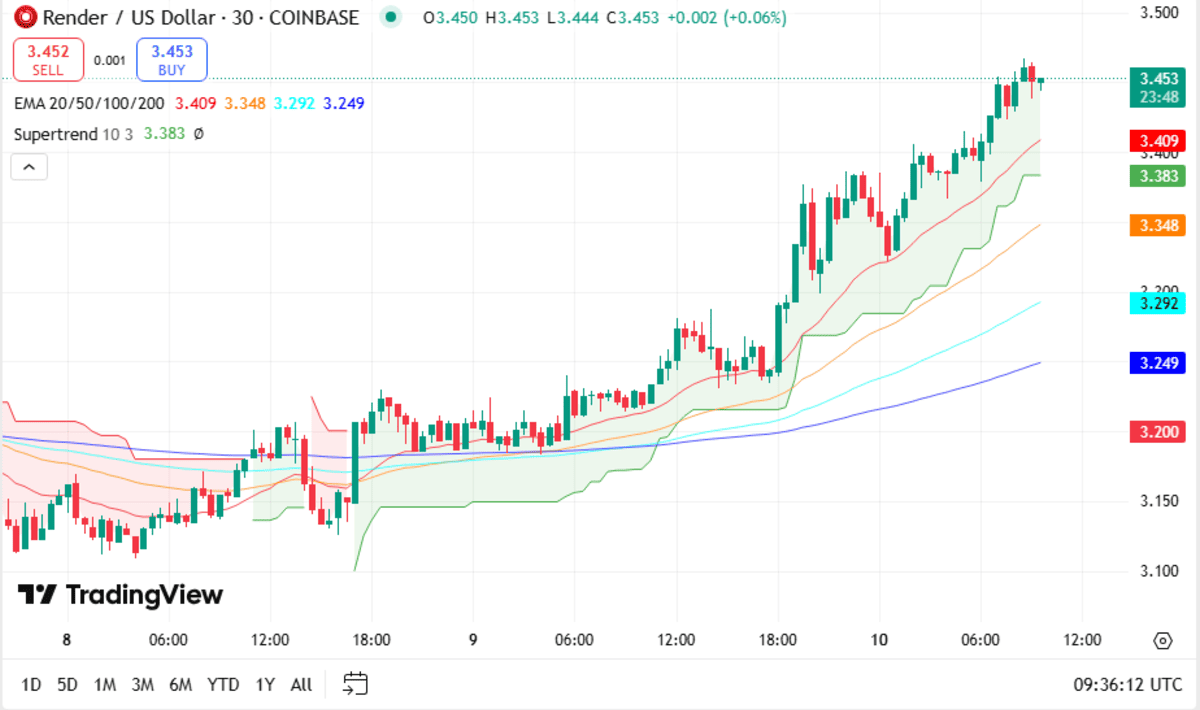
Source: TradingView
Render Token is now trading at $3.45, indicating a stabilisation following previous market swings. With a market capitalization of $1.8 billion and a 24-hour trading volume of $79.86 million, investor interest remains strong, though momentum has slowed marginally.
Circulating Supply is 518.89 million RNDR, with a maximum supply of 644.16 million, showing low inflation pressure—a positive for long-term value. If momentum builds, the following resistance levels may test the $3.75 to $4.10 zone. However, if selling pressure returns, support may be tested near $3.25 and $3.00.
The Graph
Although the Graph (GRT) is based on Ethereum, it is a crucial component of the Solana ecosystem, serving as a robust data indexing and querying protocol. Consider it the “Google of blockchains”, it enables developers to quickly and effectively access blockchain data via open APIs known as subgraphs.
As a global data layer for Web3, The Graph organises decentralised data across networks such as Solana, Ethereum, and IPFS. It organises large volumes of information using artificial intelligence and machine learning, allowing dApps to access exactly what they need. With its native token, GRT, powering the ecosystem, The Graph remains an essential component in the decentralized internet revolution.
The Graph Technical Overview – 2025
| Current Price | $0.09 |
| Market Cap | $896.27M |
| Support levels (Fibonacci, S1/S2/S3) | $0.0904 / $0.0892 / $0.0876 |
| Supertrend (10,3) | $3.383 |
| Resistance levels | $0.0910 / $0.0920 |
| Circulating Supply | 9.87B GRT |
| Max Supply | 10.8B GRT |
| Vol(24H) | $84.77M |
| Founder | Yaniv Tal, Jannis Pohlmann and Brandon Ramirez |

Source: TradingView
After regaining the major support levels, the graph is carrying on with a gradual uptrend. GRT is backed by an RSI of about 57 that shows a renewed interest and is likely arranging an upward breakout. RSI is still stable in the bullish-neutral region; a breakout above $0.0915 can lead to another rally. A fall below $0.0890 may result in a slide towards the $0.0860 support level.
At that time, in the middle of July 2025, GRT was priced at $0.0909, and the total value of the market was $868.33 million while the amount of trades in a day was $40.59 million. If the request for the Web3 indexing and the AI applications will increase, GRT might revisit the $0.095–$0.10 range for the rest of 2025.
Know More: Top Crypto Airdrops
Helium
Helium Network is one of the most innovative projects in the Solana ecosystem, pioneering a decentralised wireless communication model for the Internet of Things (IoT). Rather than depending on established telecom behemoths, Helium enables ordinary people to create and power a global network utilising blockchain technology.
Users can provide wireless coverage while earning HNT (Helium Network Token) by deploying simple hardware devices known as Hotspots. This incentive-driven paradigm establishes a secure, scalable, and energy-efficient network for IoT devices, enabling a range of applications from smart sensors to asset tracking. Helium’s recent shift to Solana has increased its speed and scalability, solidifying its position in determining the future of decentralised wireless infrastructure.
Helium Technical Overview – 2025
| Current Price | $2.37 |
| Market Cap | $439.52M |
| Support levels (Fibonacci, S1/S2/S3) | $2.388 / $2.373 / $2.356 |
| Supertrend (10,3) | $2.346 |
| EMA 20 / 50 / 100 / 200 | $2.388 / $2.373 / $2.356 / $2.333 |
| Resistance levels | $2.386 / $2.40 |
| Circulating Supply | 184.8M HNT |
| Max Supply | 223M HNT |
| Vol(24H) | $6.85M |
| Founder | Amir Haleem |

Source: TradingView
Helium is moving sideways with minimal volatility after failing to maintain above resistance. On the Relative Strength Index (RSI) just below 50, HNT displays uncertainty, which means it is still waiting for a catalyst that will indicate the direction. RSI is in a neutral range; thus, a breakout or a breakdown situation can be expected soon. If there is a rally above $2.40, this could be a bullish breakout; however, if there is a fall below $2.33, the selling pressure is likely to increase.
By the middle of July 2025, HNT was priced at approximately $2.37, with a market value of $355 million, and the 24-hour volume of trades was $11.8 million. If the demand for decentralized wireless networks continues to rise and partnerships continue to be formed, HNT may target a price range of $2.70–$3.00 by the end of 2025, aligning with the growth of Web3 infrastructure.
PENGU: Pudgy Penguin’s Official Memecoin
PENGU is the native coin of Pudgy Penguins. Pudgy Penguins has become the face of crypto with one of the most influential communities in the industry. From large companies wearing the Penguin, to being featured in ETF commercials, to garnering millions of followers and over 50 billion views, the Penguin has become a cultural icon. PENGU allows for the ever-expanding Pudgy Penguin fanbase and the hundreds of millions of people outside of crypto who see and share the Pudgy Penguin every day to join The Huddle. PENGU is a symbol for community, memes, and good vibes.
PENGU Technical Overview – 2025
| Current Price | $0.01926 |
| Market Cap | $1.2B |
| Support levels (Fibonacci, S1/S2/S3) | $0.01804 / $0.01669 / $0.01597 |
| Supertrend (10,3) | $0.01823 |
| EMA 20 / 50 / 100 / 200 | $0.01804 / $0.01669 / $0.01597 / $0.01562 |
| Resistance levels | $0.01950 / $0.02000 |
| Circulating Supply | 62.86B PENGU |
| Max Supply | 88.88B PENGU |
| Vol(24H) | $750,305,129.24 |
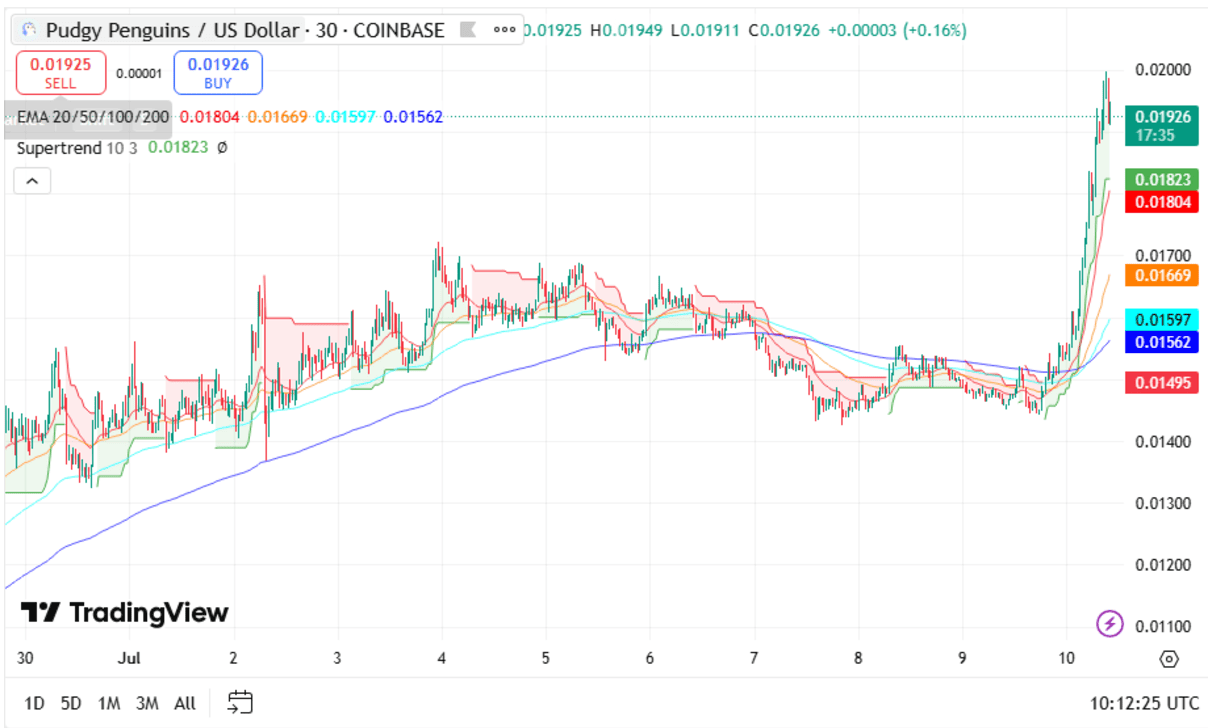
Source: TradingView
PENGU broke out of its consolidation zone with a 30% rally from $0.015 to $0.0195. The EMA crossover and the green Supertrend at $0.01823 have confirmed the positive momentum. The price extends above all the major EMAs, with resistance at $0.020. A breakout may lead targets to the $0.022–$0.023 range.
There is support at $0.01805 and $0.01669. Provided that PENGU does not fall below these levels, the positive trend should remain intact. A drop under $0.0155 could negate the current upward movement. As the meme coin hype grows and trading volumes increase, PENGU is set to stay strong for July, subject to the market sentiment and resistance at the $0.020 level.
Want a detailed analysis? Read our updated Pengu Price Prediction 2025
Conclusion
Finally, the Solana ecosystem continues to demonstrate its value as a source of innovation and growth in the crypto industry. From Solana’s lightning-fast blockchain to game-changing projects like Chainlink, Render Token, The Graph, and Helium Network, each token adds something new to the mix. These efforts are not merely about developing technology; they are shaping the future of decentralization. As we approach 2025, keeping a close eye on the top Solana ecosystem tokens may provide both strategic insights and interesting opportunities. Solana is a market to watch, whether you’re looking to invest or simply explore.
How Can You Invest in These Top Solana Projects in 2025?
Navigating the world of crypto investments is now more accessible than ever. Simply create an account on CoinDCX, fulfill the required KYC procedures, and you’re ready to invest in your preferred cryptos! Seize the opportunity to invest in these leading crypto tokens for 2025 by downloading CoinDCX, the dedicated crypto investment app!

