


The crypto market never sleeps, and if there’s one thing investors are always on the lookout for, it’s hidden gems. While Bitcoin and Ethereum dominate the headlines, many affordable crypto tokens trade quietly in the background at a fraction of a cent.
In November 2026, with blockchain innovation at full speed and new projects constantly emerging, cheap does not mean low quality. It does not mean undervalued either. But with thousands of options out there, how do you know which ones are worth looking at?
In this blog, we’ll break down the top 10 cheapest crypto tokens by market capitalisation as of November 2026, what each project does and what its price chart currently shows. Let’s explore.
List of the Best Cheap Crypto Coins of 2026
Here is the comprehensive list of the top low-priced crypto tokens. Every token below trades under one cent and is listed on CoinDCX, and the list is ranked by market capitalisation, largest first:
| Name | Price | Market Cap |
|---|---|---|
| Shiba Inu (SHIB) | $0.000004453 | $2.62B |
| Pepe (PEPE) | $0.000004941 | $2.04B |
| Pump.fun (PUMP) | $0.003582 | $1.64B |
| Flare (FLR) | $0.005408 | $474.68M |
| VeChain (VET) | $0.005213 | $448.25M |
| Pudgy Penguins (PENGU) | $0.006314 | $396.9M |
| Bonk (BONK) | $0.000002833 | $249.31M |
| Terra Classic (LUNC) | $0.00003890 | $214.8M |
| FLOKI (FLOKI) | $0.00002098 | $199.87M |
| JasmyCoin (JASMY) | $0.003608 | $178.42M |
The table of penny crypto coins is updated as of 11 November 2026. Source: CoinMarketCap.com
1) SHIB (Shiba Inu)
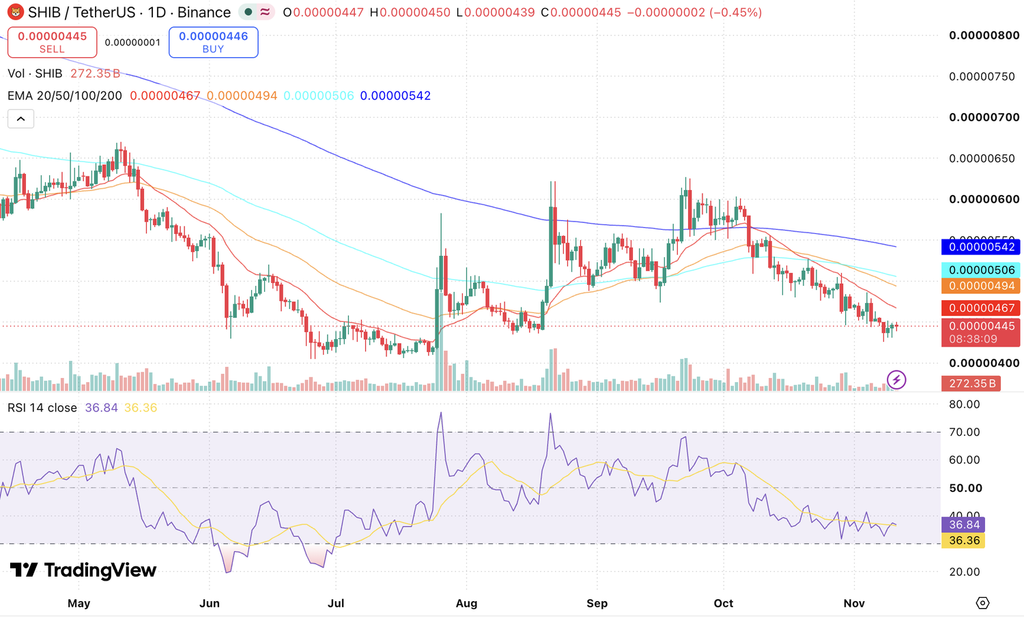
Shiba Inu Price Chart. Source: TradingView
Shiba Inu is the largest token on this list, at a market capitalization of $2.62 billion, and it trades below all four of its key moving averages on the daily chart. At $0.00000445 on the chart, price sits under the 20-day EMA at $0.00000467, the 50-day at $0.00000494, the 100-day at $0.00000506 and the 200-day at $0.00000542. An exponential moving average, or EMA, is simply the average price over a set number of days, weighted towards recent days. SHIB is down 35.4% so far in 2026.
RSI at 36.84 against a signal line of 36.36 sits well below the neutral midpoint of 50. RSI, the Relative Strength Index, measures how hard a price has moved recently on a scale of 0 to 100, and readings under 30 are described as oversold. One figure to weigh before trading: SHIB turned over $51.05 million in 24 hours against its $2.62 billion market capitalisation, a ratio of roughly 1.9%. A ratio this low means a large order can move the price against the person placing it.
| Metric | Value |
|---|---|
| Current Price | $0.000004453 |
| Market Capitalisation | $2.62B |
| Circulating Supply | 589.23T SHIB |
| Max Supply | 589,552,695,333,683 SHIB |
| 24h Volume | $51.05M |
| 2026 YTD Change | -35.4% |
Read More: Shiba Inu Price Prediction
2) PEPE
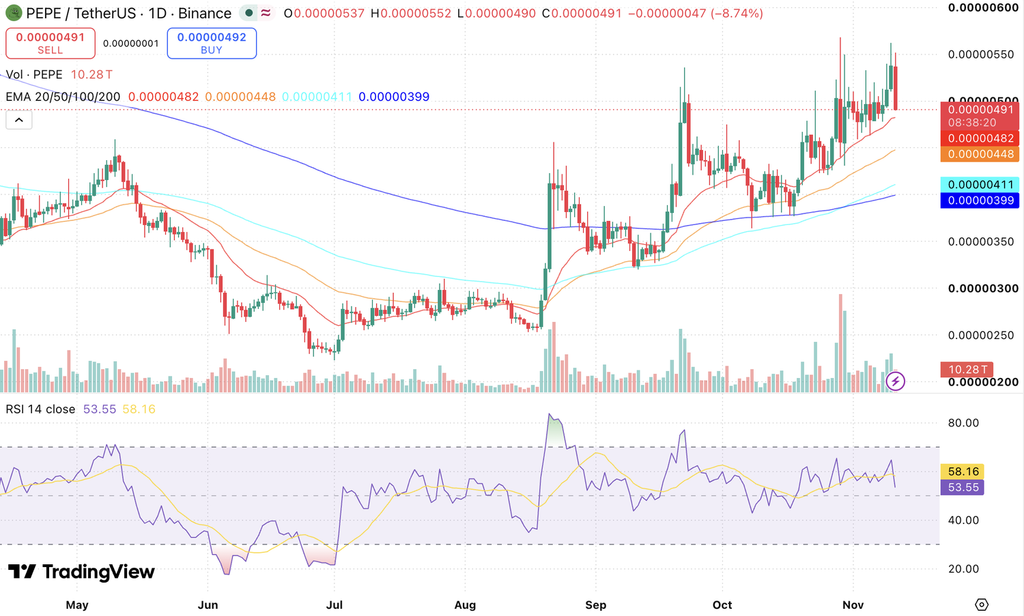
Pepe Price Chart. Source: TradingView
PEPE has the strongest chart in this group and the only one of its kind here. At $0.00000491 it trades above all four of its key moving averages: the 20-day EMA at $0.00000482, the 50-day at $0.00000448, the 100-day at $0.00000411 and the 200-day at $0.00000399. It is also one of only two tokens on this list up over 2026, at 23.3%. PEPE is a meme coin with no use beyond that, so its price moves on sentiment rather than on any underlying activity.
That strength came with a sharp single day: the chart shows price opening at $0.00000537 and closing at $0.00000491, a fall of 8.7%, which still left it above every average. RSI at 53.55 against a signal of 58.16 sits just above the neutral midpoint but below its own signal. PEPE is by a wide margin the most heavily traded token here, turning over $836.96 million in a day against a $2.04 billion market capitalization, a ratio above 40%. For anyone buying or selling, that ratio matters more than the price itself: it means an order of ordinary size can be filled without moving the market against them.
| Metric | Value |
|---|---|
| Current Price | $0.000004941 |
| Market Capitalisation | $2.04B |
| Circulating Supply | 413.77T PEPE |
| Max Supply | 413,772,350,098,154 PEPE |
| 24h Volume | $836.96M |
| 2026 YTD Change | +23.3% |
Read More: PEPE Price Prediction
3) PUMP (Pump.fun)
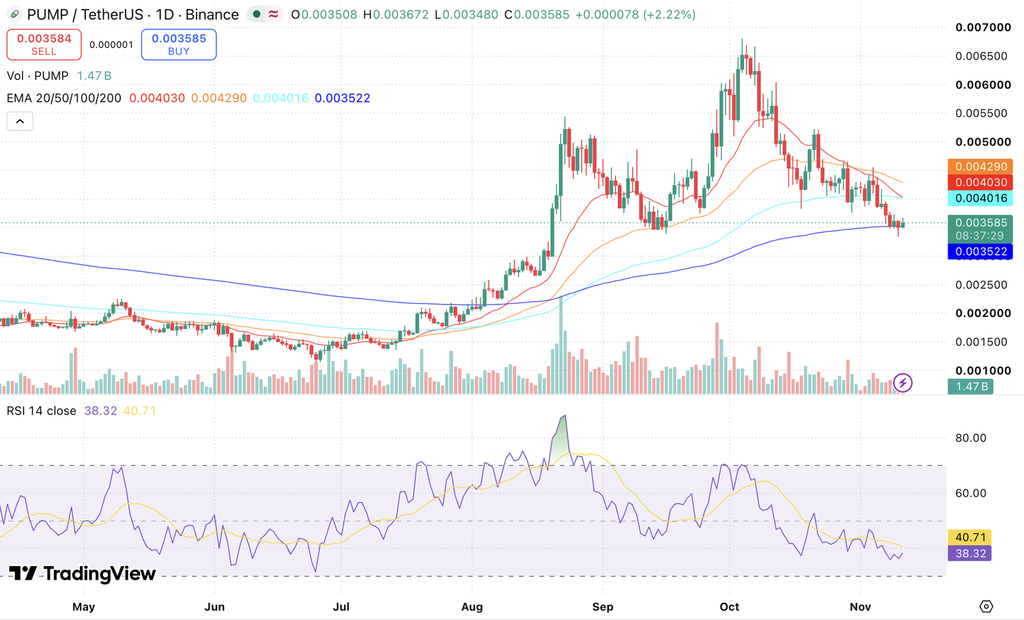
Pump.fun Price Chart. Source: TradingView
Pump.fun is a platform on the Solana blockchain where anyone can create and trade a new meme token, and PUMP is the token attached to it. At $1.64 billion it is the third-largest holding here and the only other token on this list up over the year, at 89.3%. The chart has turned down from that run: price at $0.003585 sits below the 20-day EMA at $0.004030, the 100-day at $0.004016 and the 50-day at $0.004290, holding only above the 200-day at $0.003522.
RSI at 38.32 against a signal of 40.71 is below neutral, and the chart shows price down roughly a fifth over the past week. Supply is the other thing to check. 458.45 billion PUMP circulate against a maximum supply of 1 trillion, so well over half of the tokens that will ever exist have not yet reached the market, and tokens released later can reduce the value of those held now. Daily turnover of $110.41 million against the $1.64 billion market capitalisation gives a ratio near 6.7%.
| Metric | Value |
|---|---|
| Current Price | $0.003582 |
| Market Capitalisation | $1.64B |
| Circulating Supply | 458.45B PUMP |
| Max Supply | 1T PUMP |
| 24h Volume | $110.41M |
| 2026 YTD Change | +89.3% |
4) FLR (Flare)
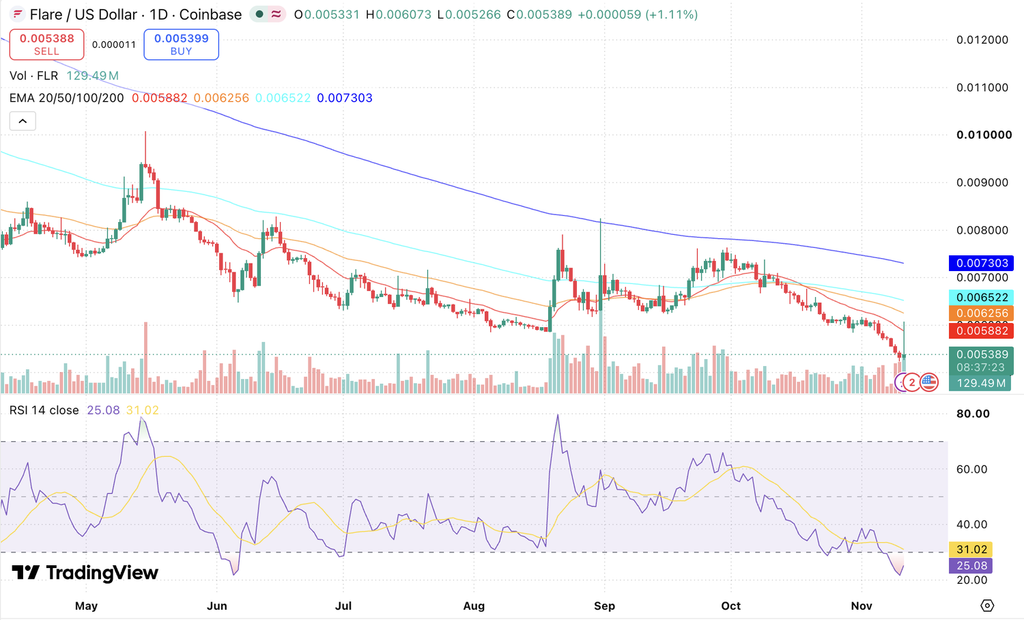
Flare Price Chart. Source: TradingView
Flare is a blockchain designed to bring outside data onto the chain so that smart contracts can use it. Its chart is the weakest here. Price at $0.005389 sits below the 20-day EMA at $0.005882, the 50-day at $0.006256, the 100-day at $0.006522 and the 200-day at $0.007303, with the four averages stacked in order from shortest to longest. That ordering is what an uninterrupted decline produces, because each longer average still carries higher prices from further back. FLR is down 48.1% over 2026.
RSI at 25.08 against a signal of 31.02 is the lowest reading in this group and well under the 30 line conventionally read as oversold. Oversold does not mean cheap, it means selling has been persistent. The more serious issue is liquidity. FLR turned over $5.86 million against a $474.68 million market capitalization, a ratio of about 1.2%. On a list where Pepe trades above 40%, Flare is effectively untradeable at size, and an order of any real value would move the price.
| Metric | Value |
|---|---|
| Current Price | $0.005408 |
| Market Capitalisation | $474.68M |
| Circulating Supply | 87.77B FLR |
| Max Supply | n/a |
| 24h Volume | $5.86M |
| 2026 YTD Change | -48.1% |
5) VET (VeChain)
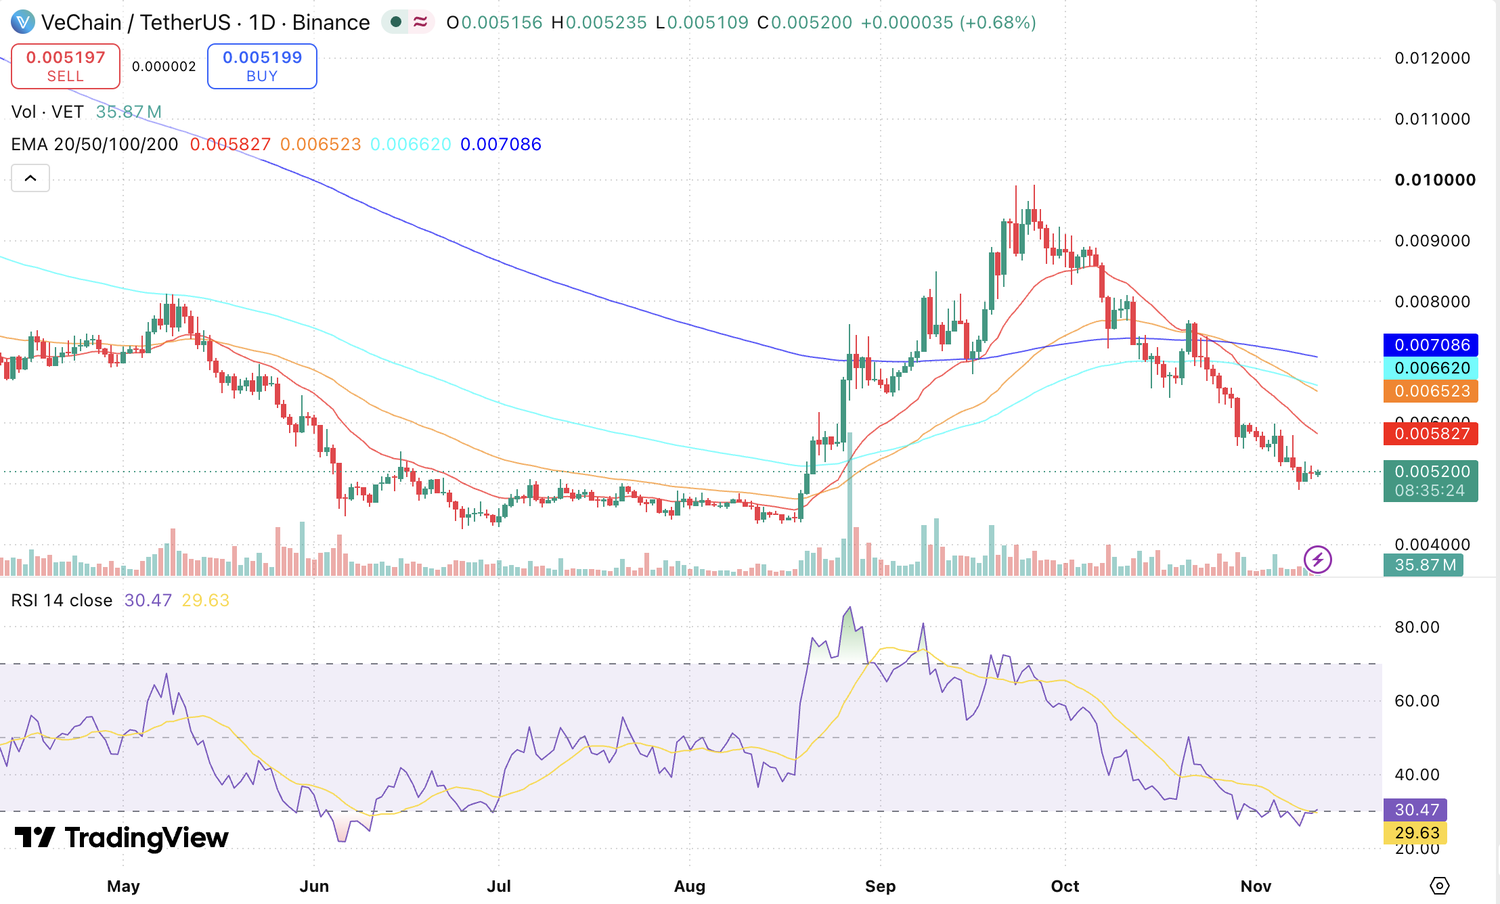
VeChain Price Chart. Source: TradingView
VeChain is a blockchain built for supply chain tracking, used by businesses to record where goods have travelled and to verify that they are genuine. Of the tokens here it has one of the clearest real-world applications. It is also down 50.1% over 2026, the second-steepest fall on this list, and the chart has gone with it. At $0.005200 price sits below the 20-day EMA at $0.005827, the 50-day at $0.006523, the 100-day at $0.006620 and the 200-day at $0.007086.
RSI at 30.47 against a signal of 29.63 sits on the oversold line, with the two lines close together, which points to a market that has stopped falling quickly rather than one that has turned. Liquidity is the weak point. VET traded $9.76 million in 24 hours against a $448.25 million market capitalization, a ratio of about 2.2%. Alongside Flare and Shiba Inu, that places it among the three thinnest markets on this list, and thin markets are harder to exit than to enter.
| Metric | Value |
|---|---|
| Current Price | $0.005213 |
| Market Capitalisation | $448.25M |
| Circulating Supply | 85.98B VET |
| Max Supply | 86,712,634,466 VET |
| 24h Volume | $9.76M |
| 2026 YTD Change | -50.1% |
6) PENGU (Pudgy Penguins)
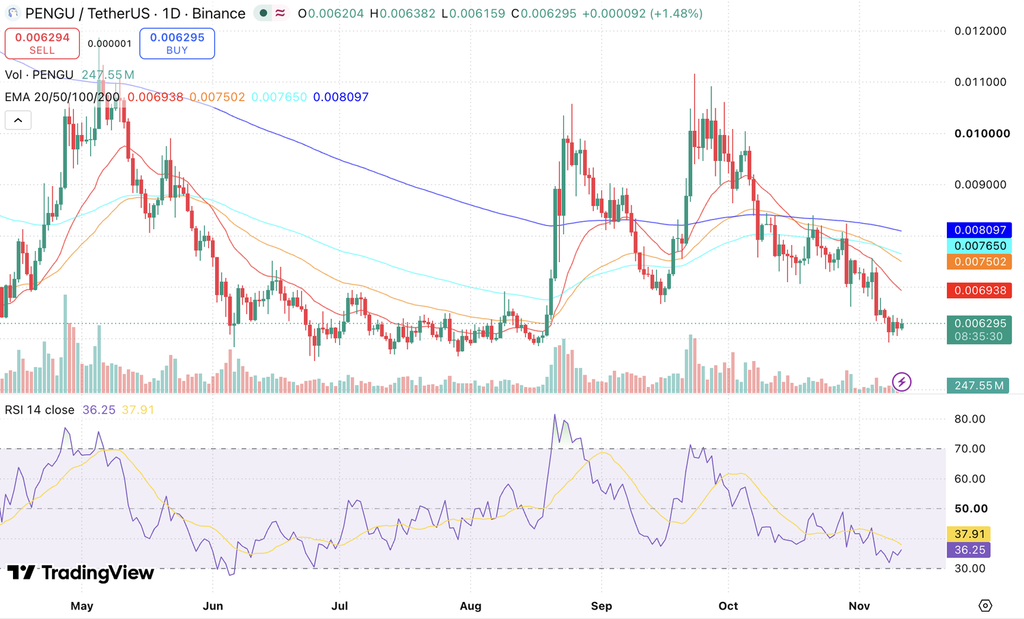
Pudgy Penguins Price Chart. Source: TradingView
Pudgy Penguins began as a collection of digital collectibles and the project now sells physical toys through retail stores, with PENGU as the token attached to that brand. At $0.006295 on the chart it trades below all four key averages: the 20-day EMA at $0.006938, the 50-day at $0.007502, the 100-day at $0.007650 and the 200-day at $0.008097. The token is down 26.8% over 2026, the mildest fall among the eight decliners here apart from Terra Classic.
RSI at 36.25 against a signal of 37.91 is below neutral and below its signal line. What separates PENGU from most of this list is how much of it changes hands: $57.34 million in 24 hours against a $396.9 million market capitalization, a ratio above 14% and the second highest here. Set against that, 62.86 billion tokens circulate out of a maximum 88.88 billion, so close to 30% of the eventual supply has still to reach the market.
| Metric | Value |
|---|---|
| Current Price | $0.006314 |
| Market Capitalisation | $396.9M |
| Circulating Supply | 62.86B PENGU |
| Max Supply | 88.88B PENGU |
| 24h Volume | $57.34M |
| 2026 YTD Change | -26.8% |
7) BONK
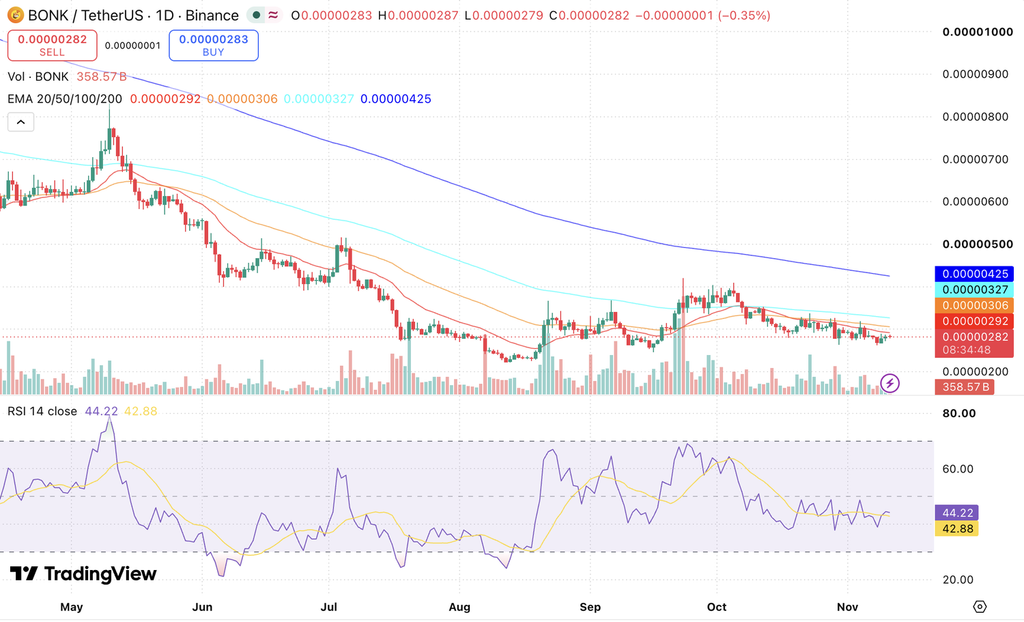
Bonk Price Chart. Source: TradingView
Bonk is a meme coin on the Solana blockchain. At $0.00000282 it trades below every key average: the 20-day EMA at $0.00000292, the 50-day at $0.00000306, the 100-day at $0.00000327 and the 200-day at $0.00000425. The distance to the 200-day is the widest on this list in proportional terms, and the year explains why: BONK is down 62.0% over 2026, the steepest fall of the ten.
RSI at 44.22 against a signal of 42.88 is below neutral but not oversold, which is consistent with a slow grind lower rather than a sharp sell-off. Liquidity is reasonable for the size, at $25.86 million traded against a $249.31 million market capitalization, a ratio above 10%. Nearly all the supply has been issued, at 87.99 trillion of a maximum 88.87 trillion, so there is little further dilution ahead from new tokens entering circulation.
| Metric | Value |
|---|---|
| Current Price | $0.000002833 |
| Market Capitalisation | $249.31M |
| Circulating Supply | 87.99T BONK |
| Max Supply | 88.87T BONK |
| 24h Volume | $25.86M |
| 2026 YTD Change | -62.0% |
8) LUNC (Terra Classic)
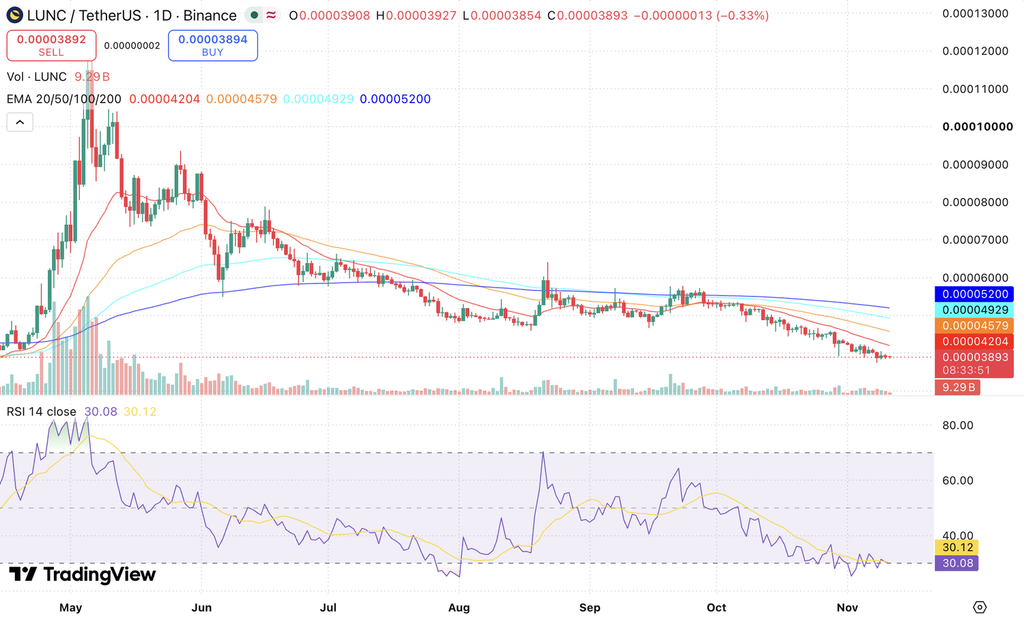
Terra Classic Price Chart. Source: TradingView
Terra Classic is the original Terra blockchain, left running after the Terra ecosystem collapsed in May 2022. The chain and its token still exist and still trade, but that history is part of what a buyer takes on, and it should be understood before any order is placed. On the chart, price at $0.00003893 sits below the 20-day EMA at $0.00004204, the 50-day at $0.00004579, the 100-day at $0.00004929 and the 200-day at $0.00005200, with the averages in strict ascending order.
RSI at 30.08 against a signal of 30.12 sits exactly on the level conventionally treated as oversold. Of the eight tokens here that fell over 2026, Terra Classic fell least, at 7.7%, which reflects a price that was already low rather than a recovery. Trading volume of $5.94 million against a $214.8 million market capitalization gives a ratio under 3%, so this is among the thinner markets on the list.
| Metric | Value |
|---|---|
| Current Price | $0.00003890 |
| Market Capitalisation | $214.8M |
| Circulating Supply | 5.52T LUNC |
| Max Supply | 6.44T LUNC |
| 24h Volume | $5.94M |
| 2026 YTD Change | -7.7% |
9) FLOKI
Floki Price Chart. Source: TradingView
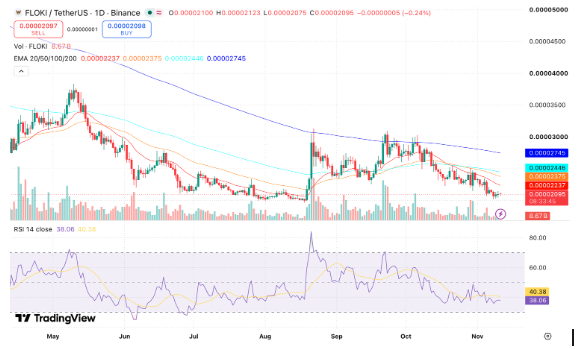
FLOKI is a meme coin that has built a games and education arm around its token. Price at $0.00002095 trades below the 20-day EMA at $0.00002237, the 50-day at $0.00002375, the 100-day at $0.00002446 and the 200-day at $0.00002745. The three shorter averages sit within $0.00000209 of each other, so a move of a few per cent would take price back into that cluster. FLOKI is down 46.7% over 2026.
RSI at 38.06 against a signal of 40.38 is below neutral and below its signal line, in line with most of this list. Liquidity is solid for the size, at $21.17 million traded in 24 hours against the $199.87 million market capitalization, a ratio above 10%. Supply is almost fully issued, at 9.52 trillion of a 10 trillion maximum, which leaves limited dilution ahead.
| Metric | Value |
|---|---|
| Current Price | $0.00002098 |
| Market Capitalisation | $199.87M |
| Circulating Supply | 9.52T FLOKI |
| Max Supply | 10T FLOKI |
| 24h Volume | $21.17M |
| 2026 YTD Change | -46.7% |
10) JASMY (JasmyCoin)
Jasmy Price Chart. Source: TradingView
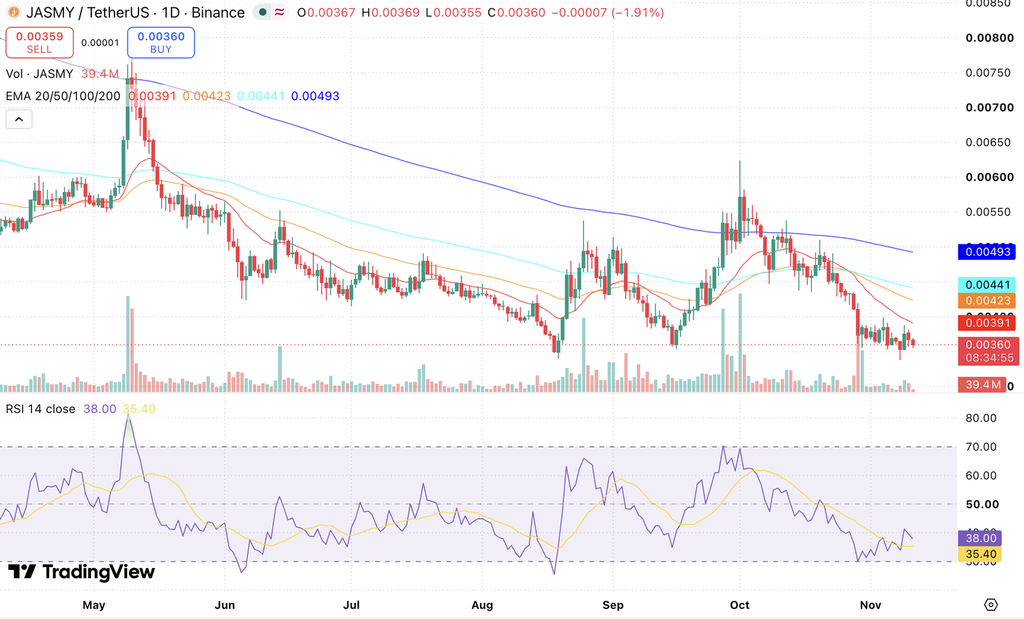
JasmyCoin is a Japanese project building a system that lets people keep control of the data their devices produce and choose who may use it. It is the smallest holding on this list at a market capitalization of $178.42 million. Price at $0.00360 trades below the 20-day EMA at $0.00391, the 50-day at $0.00423, the 100-day at $0.00441 and the 200-day at $0.00493, and the token is down 35.8% over 2026.
RSI at 38.00 against a signal of 35.40 is below neutral, though the reading sits above its own signal line, which is the one sign here of selling pressure easing rather than building. Daily turnover of $12.16 million against the $178.42 million market capitalisation gives a ratio near 6.8%. Supply is close to fully issued, at 49.44 billion of a 50 billion maximum, so very little dilution remains ahead.
| Metric | Value |
|---|---|
| Current Price | $0.003608 |
| Market Capitalisation | $178.42M |
| Circulating Supply | 49.44B JASMY |
| Max Supply | 50,000,000,000 JASMY |
| 24h Volume | $12.16M |
| 2026 YTD Change | -35.8% |
Conclusion
Investing in low-cost crypto tokens can be a way to enter the digital asset world without committing large sums. Tokens like Pepe (PEPE), Shiba Inu (SHIB) and Bonk (BONK) are not as well known as Bitcoin or Ethereum, but they trade actively and at a fraction of a cent. While meme coins and affordable tokens are often viewed as risky, their low entry price allows investors to take small positions across several assets.
The technical picture across this list is lopsided. Pepe is the only token trading above all four of its key moving averages. Pump.fun holds above its 200-day average alone, and the remaining eight trade below every major average, with Flare at an RSI of 25.08 and Terra Classic at 30.08, both at or under the level usually read as oversold. Eight of the ten are down over 2026 so far, from Terra Classic at 7.7% to Bonk at 62.0%, while Pump.fun is up 89.3% and Pepe 23.3%. That spread matters more than the shared label of being cheap, because it separates tokens that have steadied from those still declining.
As blockchain technology continues to grow, projects focusing on real-world use cases, like VeChain (VET) in supply chain tracking or Flare (FLR) in bringing outside data on-chain, sit on this list on price alone. Both currently trade below all four of their key averages, and both turn over less than 2.5% of their market capitalisation in a day. The volatile nature of the crypto market demands vigilance. Successful investing requires more than just following trends; it’s about doing due diligence, understanding market dynamics and being prepared for short-term fluctuations.
FAQs
Q1. Which is the cheapest crypto to invest in 2026?
By unit price, the cheapest tokens on this list are Bonk (BONK) at $0.000002833, Shiba Inu (SHIB) at $0.000004453, Pepe (PEPE) at $0.000004941 and FLOKI at $0.00002098. Unit price alone says nothing about value: what matters is market capitalization, which is the price multiplied by the circulating supply.
Q2. Are cheap cryptos a good investment?
Some low-priced tokens move quickly in both directions, which makes the risk correspondingly higher. Before investing, analyse the token’s utility, market trends and technical indicators. Eight of the ten tokens here are down on the year, and only Pepe trades above all four of its key moving averages.
Q3. Can cheap crypto tokens reach $1?
For most tokens on this list, it is not realistic. Shiba Inu has 589.23 trillion tokens in circulation, so a $1 price would imply a market capitalization larger than the entire global economy. Pepe and Bonk face the same arithmetic. VeChain, at 85.98 billion, faces a smaller but still extreme hurdle.
Q4. Where can I buy cheap cryptos in India?
You can buy low-priced crypto assets on CoinDCX, an FIU-registered platform that supports INR deposits and offers a wide variety of altcoins. Complete your KYC using PAN and Aadhaar, add funds through UPI or bank transfer, then search for the token and confirm the trading pair before placing your order.
Q5. What factors should I consider before investing in low-priced crypto?
Market capitalization, trading volume, the reliability of the team and overall market sentiment all matter more than the price itself. Also check the ratio of daily volume to market capitalisation, which tells you whether you can realistically enter and exit a position. On this list it ranges from Pepe above 40% to Flare under 1.3%.
Q6. How We Picked These Cheap Crypto Tokens?
We screened for tokens trading under one cent that are listed on CoinDCX, then ranked them by market capitalization. For each token we checked daily trading volume against market capitalisation, how much of the supply is already issued, and the daily chart against its 20, 50, 100 and 200-day EMAs and RSI(14).
Additional Read:
1. Top 10 Real-World Assets (RWA) Tokens
2. Top Artificial Intelligence (AI) Crypto Coins
3. Top Meme Coins by Market Cap