


This Binance Coin price analysis evaluates short-term, medium-term, and multi-year BNB trends with daily, weekly, 2026, 2030, and 2040 projections. Using technical indicators including the Relative Strength Index (RSI), exponential moving averages (EMAs), and volume profiles, this forecast outlines dynamic support levels, overhead resistance markers, and potential expansion targets based on prevailing market structure.
Binance Coin (BNB) trades near $753.50 as of October 12, 2026, reflecting stabilizing market sentiment. The spot price has rebounded 5.1% off the $717.07 breakdown low and now sits just beneath the 20-day EMA at $761.17, after the 50-day EMA held as dynamic support through the recent sell-off. Concurrently, the 50-day and 200-day EMAs are positioned at $734.06 and $684.08, respectively. The 14-day RSI has recovered to 48.82, trailing its 14-day signal moving average at 54.93 by 6.11 points. Based on these technical indicators, BNB is expected to consolidate between $745 and $761 while defending dynamic support around $734 before attempting its next directional break.
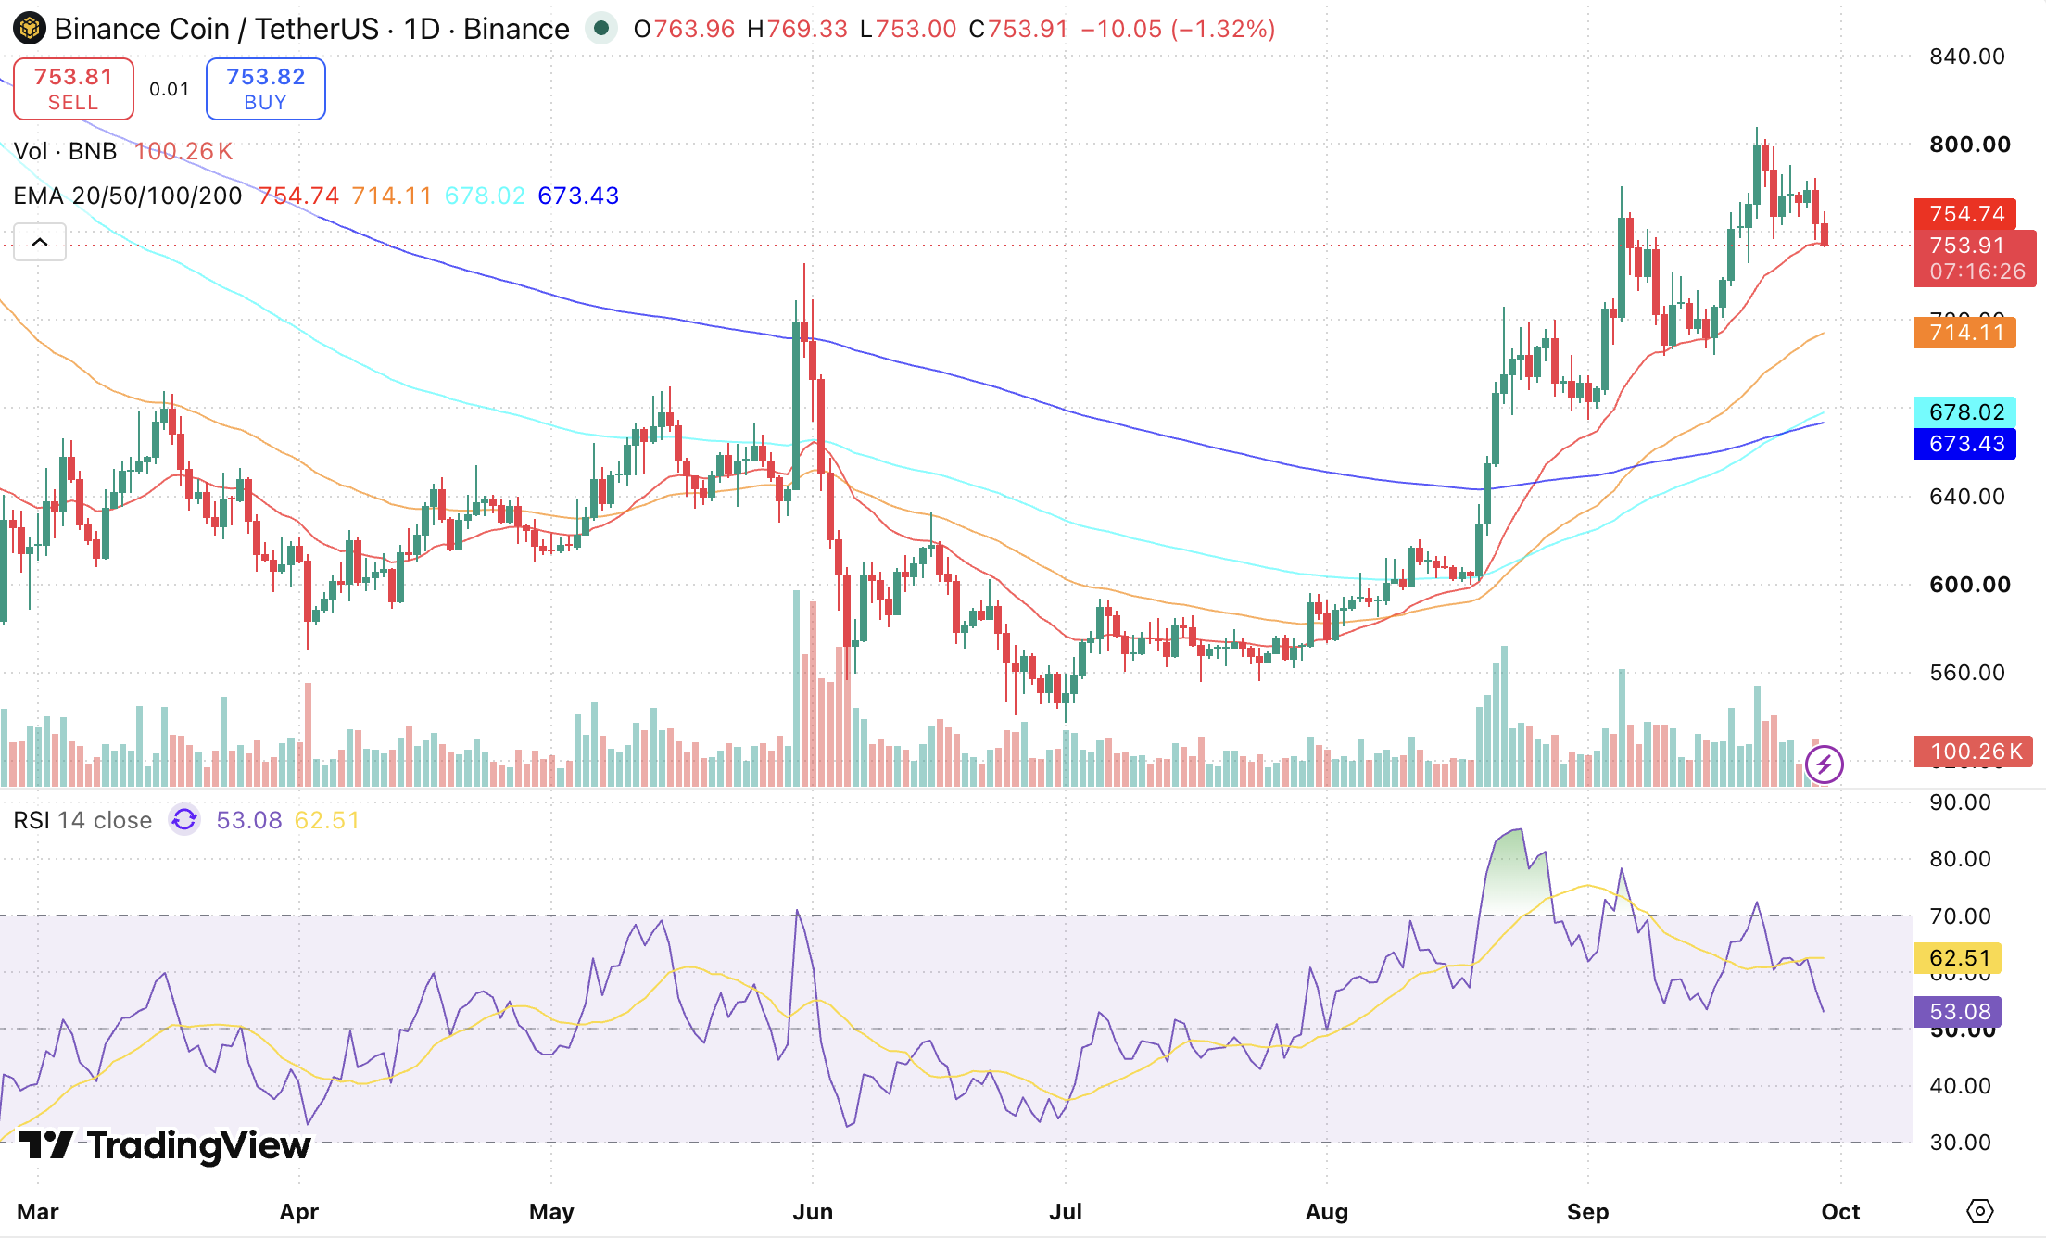
BNB/USDT, Source: TradingView
Key Insights
- BNB is projected to trade between $732 and $775 this week as it retests the 20-day EMA at $761.17 from below, a level that must flip back into dynamic support for the recovery to extend.
- For October 2026, BNB targets $770 for the month, with $715 representing the primary structural floor buyers must defend, while reclaiming the 20-day EMA remains the initial prerequisite on the way back up.
- By 2026 and 2030, long-term movement will depend on market cycles, and the 100-day EMA at $697.06 sits $12.98 above the 200-day EMA at $684.08, confirming that the bullish crossover has continued to widen through the correction.
- Current technical analysis: The RSI has recovered from 42.63 to 48.82, narrowing its gap to its own average from 15.50 to 6.11 points, though it has yet to reclaim the 50 midline.
Binance Coin Short-Term Price Prediction: Today, This Week, October 2026
Here is the BNB Coin price prediction 2026 for today, this week, and October 2026.
| Timeframe | Price Target | Support | Resistance | ROI |
|---|---|---|---|---|
| Next 24 Hrs | $758 | $745 | $765 | +0.60% |
| This Week | $760 | $732 | $775 | +0.86% |
| October 2026 | $770 | $715 | $795 | +2.19% |
BNB Price Prediction Today
Based on technical analysis, Binance Coin is projected to target $758 over the next 24 hours, with support at $745 and resistance at $765. The session low of $744.77 held, with the spot price climbing toward the day’s high of $758.44 to extend the rebound off the 50-day EMA at $734.06. Overhead resistance at $765 sits just above the 20-day EMA at $761.17, which remains the first major ceiling to clear. The 20-day EMA is now the operational pivot: a daily close above it puts $765 and the upper weekly band in range, whereas a break below $745 opens downside testing toward the 50-day EMA near $734..
Binance Coin Price Prediction for This Week
The BNB price for this week is projected to sit between $732 and $775. The rebound off the 50-day EMA has halted the correction triggered by the 4.69% breakdown, but a confirmed recovery still requires consecutive daily closes back above the 20-day EMA at $761.17. The $732 floor sits just beneath the 50-day EMA at $734.06, marking the primary structural shelf below the current range, while $775 caps the upper consolidation band. With the 14-day RSI at 48.82 still below the 50 midline, price action favors a cautious retest of resistance over a decisive breakout.
Binance Coin Price Prediction for October 2026
In October, BNB is expected to close near $770 within an expected channel of $715 to $795. A target above current spot levels is supported by macro trendline alignment, where the 100-day EMA at $697.06 remains positioned above the 200-day EMA at $684.08, leaving price 8% to 10% clear of both. Losing $715 would invalidate this outlook, confirm a double top beneath $800, and trigger a broader correction toward the 200-day EMA. On the upside, $795 sits just below the $800 ceiling that has now rejected price in both September and October, and the 20-day EMA at $761.17 must be recovered first.
Binance Coin Price Prediction for November 2026
By the end of November, BNB is forecast to target $785, with the expected trading band widening between $720 and $815. Reaching this level depends on two conditions: an October close above $770 and the reclamation of the 20-day EMA as dynamic support. Once spot price trades back above it, the $720 zone converts into a structural floor. Reaching the $815 upper bound requires a confirmed daily close above $800.
Read Also: How to buy Binance Coin in India
BNB Price Prediction 2026 (Medium Term)
| Month | Price Target | Support | Resistance | ROI |
|---|---|---|---|---|
| Oct 2026 | $770 | $715 | $795 | +2.19% |
| Nov 2026 | $785 | $720 | $815 | +4.18% |
| Dec 2026 | $810 | $745 | $840 | +7.50% |
Binance Coin’s 2026 price range is projected at $715 to $840, with an expected December target of $810. Spot price is trading just beneath the 20-day EMA at $761.17, leaving that level as the first resistance to reclaim after the October breakdown. Below spot, the 200-day EMA at $684.08 defines the larger macro trend, with price maintaining a 10.1% cushion above it. The 100-day EMA at $697.06 has stayed above the 200-day line through the correction, widening the crossover spread to $12.98. A weekly close back above the 20-day EMA reopens the upper half of this channel.
Binance Coin Price Prediction 2026 to 2040 (Long Term)
| Year | Price Target | Support | Resistance | ROI |
|---|---|---|---|---|
| 2027 | $920 | $830 | $1,000 | +22.10% |
| 2028 | $980 | $890 | $1,070 | +30.06% |
| 2029 | $1,050 | $955 | $1,145 | +39.35% |
| 2030 | $1,100 | $990 | $1,210 | +45.99% |
| 2031 | $1,200 | $1,080 | $1,320 | +59.26% |
| 2035 | $1,500 | $1,320 | $1,700 | +99.07% |
| 2040 | $1,800 | $1,600 | $2,100 | +138.89% |
Binance Coin 2030 Forecast: What Is the Expected Price?
The 2030 target for BNB is $1,100, within an estimated range of $990 to $1,210. BNB maintains its position above the 50-day, 100-day, and 200-day EMAs, with the 100-day remaining above the 200-day line. Long-term valuation relies on steady smart contract settlement volume, decentralized application usage, and quarterly supply deflation via the programmatic Auto-Burn mechanism.
Binance Coin 2031 Outlook and Expected Price Range
The Binance Coin price prediction for 2031 targets $1,200, with a range of $1,080 to $1,320, assuming BNB holds its reclaimed 200-day EMA and builds on the structure established in August. The BNB price outlook remains dependent on sustained momentum, volume trends, and broader crypto market strength. The current setup, with price above its 50-day, 100-day, and 200-day EMAs but just under the 20-day, and the RSI at 48.82, still below its own average, rests on structure rather than momentum. Long-term projections remain highly uncertain because the supplied chart only shows current technical indicators.
BNB Price Prediction 2040: Long-Term Forecast
By 2040, Binance Coin’s price is projected at $1,800, ranging from $1,600 to $2,100, under a long-term adoption scenario. The current chart shows BNB trading 10.1% above its 200-day EMA at $684.08, with the 100-day still above the 200-day through the correction, so this horizon depends far more on ecosystem growth and market cycles than on present technical structure. The BNB price forecast for 2040 should therefore be interpreted as a scenario range rather than a fixed target.
Binance Coin Technical Analysis
The following technical indicators were used to derive the price predictions above.
| Indicator | Value | Signal |
|---|---|---|
| Relative Strength Index (14-Day RSI) | 48.82 | Neutral, recovering |
| 20-Day EMA | $761.17 | Retesting, resistance |
| 50-Day EMA | $734.06 | Held, support |
| 100-Day EMA | $697.06 | Bullish |
| 200-Day EMA | $684.08 | Bullish |
| Average Trading Volume (14-Day) | Contracting | Low-volume rebound |
Relative Strength Index (RSI)
The 14-day RSI stands at 48.82, up from 42.63 at the breakdown and now trailing its signal average at 54.93 by 6.11 points. The rebound has narrowed the gap to the signal line considerably, but the oscillator has not yet reclaimed the 50 midline that divides an uptrend pause from an active downtrend. Because the reading sits in neutral territory, it neither confirms a renewed advance nor signals exhaustion at current levels. A close back above 50 and a cross over the signal line would frame the October drop as a shakeout, while a rollover from here would signal that the bounce is only a retest of broken support.
Exponential Moving Averages (50-Day and 200-Day EMA)
BNB trades 10.1% above its 200-day EMA at $684.08, and the 50-day EMA at $734.06 has held as support after the 4.69% breakdown, with price rebounding to $753.50, just 1% below a 20-day EMA that has eased to $761.17. Beneath that level, the structure remains intact. The 50-day EMA sits $37.00 above the 100-day at $697.06, and the 100-day remains $12.98 above the 200-day line, showing that higher-timeframe moving average alignment continues to widen. The 20-day EMA is now the resistance that defines this recovery, and only a daily close under $684 would put the longer-term macro trend back in question.
Volume Analysis
Turnover has contracted sharply on the rebound, with the latest session printing just 50.65K BNB against 184.53K on the breakdown day. Recovering on barely a quarter of the selling volume points to a relief bounce rather than fresh accumulation, which makes the current retest of the 20-day EMA a low-conviction one so far. Monitoring whether volume expands on a daily close above $761 will confirm whether this bounce can turn into a genuine recovery or fades into another rejection beneath resistance.
Disclaimer: This article is for informational purposes only and does not constitute financial or investment advice. Crypto markets are highly volatile. Always do your own research (DYOR) before making any investment decisions.
FAQs
1. Can Binance Coin (BNB) reach $10,000?
A $10,000 BNB is a 13.3x move from $753.50 and implies a market capitalization near $1.33 trillion, against roughly $100.3 billion today. Even if the Auto-Burn programme cuts supply from 133.17 million tokens to its 100 million targets, the price still values BNB at about $1 trillion.
2. How much will Binance Coin be worth in 2030?
This analysis projects BNB at $1,100 in 2030, within a range of $990 to $1,210, a 45.99% return from $753.50. This scenario assumes that BNB defends the $684.08 200-day EMA and that quarterly token burns continue reducing circulating supply.
3. Can BNB reach $5,000?
A $5,000 price target represents a 6.6x advance from $753.50, requiring a market capitalization near $666 billion at current circulating supply. This is roughly 2.8 times the $1,800 level projected for 2040. Achieving it would require multiple multi-year expansion cycles, sustained Layer-1 network demand, and substantial ongoing supply reductions.
4. What is the Binance Coin price prediction for tomorrow?
The 24-hour price target for BNB is $758, with support at $745 and resistance at $765, a 0.60% move from $753.50. Price is retesting the 20-day EMA at $761.17 from below, which caps the upside until it is reclaimed, and an RSI at 48.82 just under the 50 midline offers only neutral momentum.
5. What is the Binance Coin price prediction for 2027?
Most price prediction models project BNB at $920 in 2027, within a range of $830 to $1,000, a 22.10% return from $753.50. The December 2026 target of $810 is the intermediate step on that path. Market observers stay broadly bullish on 2027, citing ecosystem growth and wider DeFi adoption, though cycles and regulation will decide the outcome.
6. What is the Binance Coin price prediction for 2030 in INR?
BNB’s $1,100 target for 2030 works out to roughly ₹1,04,900 at a USD-INR rate near ₹95.4. The $990 to $1,210 range translates to about ₹94,450 to ₹1,15,400. Those figures move with the exchange rate as well as the BNB price.
7. What is the Binance Coin price prediction for 2040?
BNB's 2040 projection is $1,800, within a range of $1,600 to $2,100, a 138.89% return from $753.50. Across 14 years, that is compound growth of roughly 6.4% a year, a modest rate by crypto standards. A 2040 target spans several full market cycles, so it should be read as highly speculative.
8. How high will BNB go in 2026?
BNB is projected to trade between $715 and $840 through the rest of 2026, with a December target of $810. Having bounced off the 50-day EMA, BNB needs to reclaim the 20-day EMA at $761.17 and then clear $800 before the upper half of that range comes into play.
9. What will be the BNB price prediction for 2026 in rupees?
BNB price prediction ranges from $715 to $840, and this analysis works out to roughly ₹68,200 to ₹80,150 at a USD-INR rate near ₹95.4. The December target for BNB is $810 or ₹77,300. At the current $753.50, BNB is worth about ₹71,900.