


Bitcoin price has closed at $80,831, its first move above $80,000 since May, after US spot exchange-traded funds took in $1.92 billion last week, their strongest in ten months. The weekly gain of roughly 23% is Bitcoin’s largest in more than three years. The rally rests on three supports of very different quality, and the technical picture is the most stretched it has been all year.
Bitcoin Closes Above $80,000 for the First Time Since May
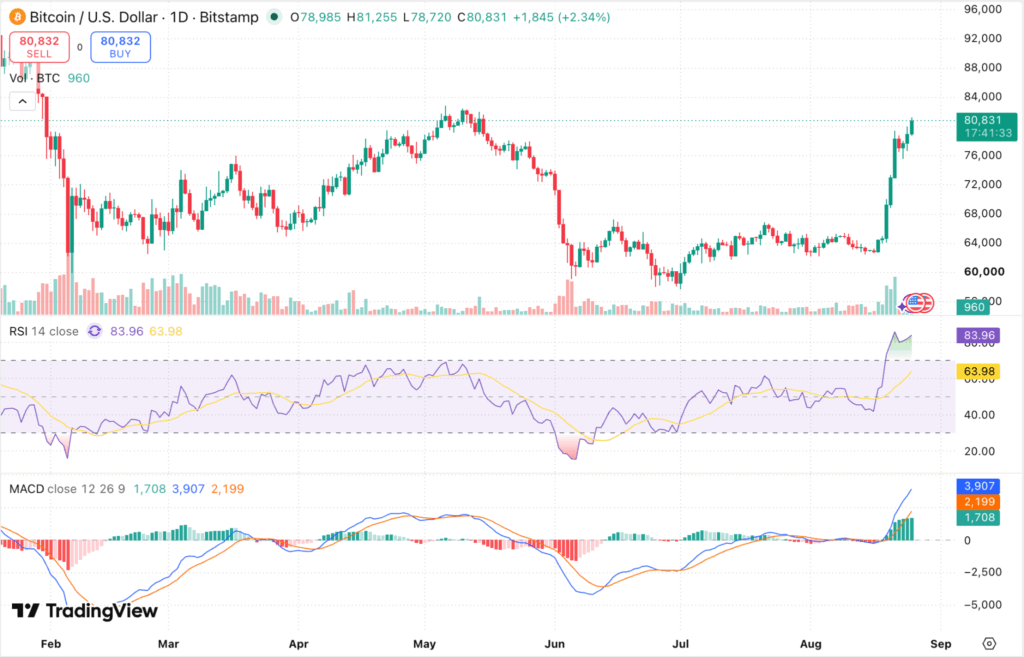
Bitcoin closed the daily session at $80,831, up 2.34% from an open of $78,985, after trading between $78,720 and $81,255. The move completes a week in which the bitcoin price surged roughly 23%, the largest weekly gain in more than three years. Perspective is worth keeping. Bitcoin remains about 36% below the record of $126,198 it set in October 2025, and May 2026 was the last time it traded meaningfully above the current level.
Bitcoin ETF Inflows Reach Their Strongest Week in Ten Months
The thirteen US spot Bitcoin funds took in a net $1.92 billion during the week of 17 to 21 August, the most since early October last year. A single day accounted for $606.3 million on 20 August, the largest in more than three months, with BlackRock’s iShares Bitcoin Trust drawing roughly $1.3 billion of the weekly total.
The reason this matters is what Bitcoin ETF buying represents. These funds buy Bitcoin outright rather than taking leveraged positions in futures, so the demand is real rather than borrowed, and it tends to come from investors with longer horizons.
One number keeps the enthusiasm in proportion. Roughly $2.9 billion has still been withdrawn from these funds across 2026 as a whole, so even after the strongest week in ten months the year remains net negative. This is a recovery in demand, not yet a reversal of it.
What Else Is Driving the Bitcoin Rally
Two other forces did much of the early work. Analysts at Bernstein traced the initial move to US Treasury plans to buy back more long-dated government bonds, a step intended to lower yields that support riskier assets by making safe ones pay less.
The second force is mechanical rather than fundamental. More than $4 billion of positions betting against Bitcoin were closed out in mid to late August, and closing them requires buying Bitcoin, which causes the price to rise and forces further closures. That buying stops once those positions are exhausted.
The distinction decides whether the Bitcoin rally holds. A move supported by fund inflows can continue after forced buying ends, while one driven by liquidations stalls when that fuel runs out. Both are present here, with fund flows providing the base and forced buying the speed.
Our crypto learning guides explain how these mechanics work in more detail.
What the Bitcoin Chart Shows at $80,831
Momentum is emphatic. The MACD line at 3,907 sits well above its signal at 2,199, giving a histogram of 1,708, and Bitcoin trades above its 20, 50, 100 and 200-day exponential moving averages, having reclaimed the 200-day line at $71,858.
BTC/USD, Source: TradingView
The caution comes from the relative strength index, which measures how far and fast a price has moved on a scale to 100. At 83.96 it sits far above the 70 mark treated as overbought, and readings that high have historically preceded a pause rather than an immediate continuation.
One structural detail suggests the recovery is early rather than mature. The 50-day average at $67,347 still sits below the 100-day at $67,662, so the medium-term trend has not fully turned despite the speed of the move.
Discover Where Bitcoin is Headed Next
Key Bitcoin Support Levels to Watch
Analysts have flagged $75,000 to $83,000 as the range Bitcoin needs to work through before it can attempt higher prices, and the session low of $78,720 is the immediate floor beneath the current price. Below that, the 200-day average at $71,858 is the level that would decide whether this remains a recovery or becomes another failed attempt.
The risk above is thin trading history. Bitcoin spent little time over $80,000 during its May visit, leaving few reference points, and the mechanism that accelerated the climb can accelerate a fall. Jayke Kyndrede of QCP Group called the market stretched but well supported, adding that the timing and depth of any retracement are hard to call while demand holds.
FAQs
1. Why has Bitcoin reclaimed $80,000?
Bitcoin reclaimed $80,000 on a combination of $1.92 billion in weekly ETF inflows, US Treasury plans to buy back long-dated bonds, and more than $4 billion of bets against Bitcoin being closed out. The token closed at $80,831, up about 23% on the week.
2. Are Bitcoin ETF inflows back to normal?
Bitcoin ETF inflows have recovered sharply but not fully. Last week's $1.92 billion was the strongest in ten months, though roughly $2.9 billion has still left these funds across 2026, leaving the year net negative.
3. What are the key Bitcoin support levels now?
Bitcoin's key support level is at $78,720, with analysts flagging $75,000 as the base of the consolidation range. The 200-day average at $71,858 is the deeper level that would signal the recovery has failed.
4. Is the Bitcoin rally overextended?
Bitcoin shows clear signs of being stretched, with the relative strength index at 83.96 against an overbought threshold of 70. Momentum remains strong, but readings this high have usually been followed by consolidation rather than immediate further gains.
Disclaimer: Crypto products and NFTs are unregulated and can be highly risky. There may be no regulatory recourse for any loss from such transactions. This article is for informational purposes only and does not constitute financial, investment or trading advice. Conduct your own research before making any investment decision.


