
coindcx-blog-logo-2026coindcx-blog-logo-2026coindcx-blog-logo-2026coindcx-blog-logo-2026
  • CRYPTO NEWS
  • TOPICS
    • Futures Trading
    • Crypto Basics
    • DeFi
    • Metaverse
    • NFT
    • Blockchain
  • CRYPTO VERSE
    • Personal Finance
    • Cryptocurrency
    • Price Predictions
    • Crypto Deep Dives
  • PRODUCT
    • Tutorials
    • Product Features
    • Security
  • COINDCX
    • Announcements
    • Community
    • Crypto Competition
    • Listings
    • Opinion
    • Stories
Visit CoinDCX
✕
            No results See all results

            Blog / Crypto News Global / Bitcoin Hits $85.5K as Shorts, ETFs and Strategy Drive a January High

            Bitcoin Hits $85.5K as Shorts, ETFs and Strategy Drive a January High

            Bitcoin climbed above $86,000 on 21 September 2026, marking its…

            22 Sep 2026 | 3 min read

            Table of Contents

            Toggle
            • Bitcoin Broke Out of Its September Range
            • The Short Squeeze Was the Largest Liquidity Driver
            • Bitcoin’s Institutional Inflows Rebounded into Net Positive Territory
            • Strategy’s Purchase Provided Psychological Confidence
            • Bitcoin’s Key Price Levels to Monitor: The $82,000 Support Baseline
            • FAQs
            • 1. Why did Bitcoin hit its highest level since January?
            • 2. How much bitcoin did Strategy buy?
            • 3. Are bitcoin ETF investors back in profit?
            • 4. Which support level are Bitcoin traders watching?

            Bitcoin climbed above $86,000 on 21 September 2026, marking its highest valuation since January before consolidating near $85,400. Three distinct market forces aligned behind the upward move: $647.9 million in short liquidations, approximately $592.5 million of US spot ETF inflows across two trading sessions, and Strategy’s first treasury acquisition since late August. However, evaluating their volume and timing reveals that these drivers differed substantially in their direct liquidity impact. 

            Bitcoin Broke Out of Its September Range

            The Bitcoin breakout cleared the $82,284 high recorded on 4 September, a resistance ceiling that had capped multiple prior rallies attempts throughout the month. Following the push above $86,000, Bitcoin settled near $85,387, down 1.39% on the session while holding 7.5% above its 20-day exponential moving average (EMA) at $79,399. 
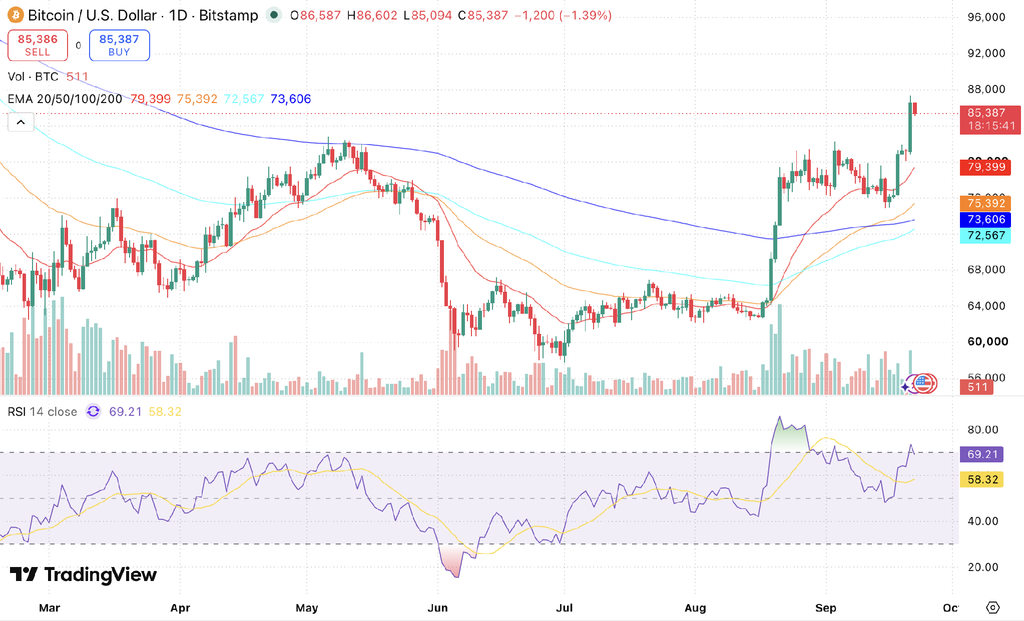
            Bitcoin daily chart with EMA 20/50/100/200 and RSI 14. Source: TradingView.

            All four primary daily moving averages currently sit beneath the spot price, with the 200-day moving average situated 16% below at $73,606. Meanwhile, the 14-day Relative Strength Index (RSI) registers at 69.21, hovering just below the standard overbought threshold of 70.

            The Short Squeeze Was the Largest Liquidity Driver

            Derivatives data indicates that a concentrated Bitcoin short squeeze served as the mechanical engine of the price advance. Short positions accounted for $647.9 million of the total $746.6 million in cross-market liquidations over a 24-hour cycle, according to CoinGlass figures, with $159.9 million wiped out in a single one-hour window. 

            Despite the clearing of bearish positions, aggregate open interest rose 7.59% to $156 billion during the rally. Traders promptly opened new contracts to replace flushed positions, indicating that systemic leverage expanded alongside spot prices. 

            Bitcoin’s Institutional Inflows Rebounded into Net Positive Territory

            US spot bitcoin ETFs lost about $746 million across 15 and 16 September, as the CLARITY vote failed and the Federal Reserve raised rates. Bitcoin ETF inflows then returned with $159.5 million on 17 September and $433 million on 18 September, the strongest day of the week, leaving the week about $6.2 million positive.

            Crucially, the upward price move lifted the broader ETF market above the estimated buys-only institutional cost basis of approximately $81,700, according to Bloomberg Intelligence data. With average holders returning to an unrealized profit, distribution pressure from break-even redemptions subsided, even though cumulative year-to-date ETF figures remain at an estimated $1.45 billion net deficit for 2026.

            Strategy’s Purchase Provided Psychological Confidence

            In an SEC filing disclosed on the morning of 21 September, the latest Strategy bitcoin purchase was officially reported. Strategy (formerly MicroStrategy) acquired 950 BTC for an aggregate consideration of $75.7 million between 14 and 20 September at an average price of $79,670 per coin. Funded entirely with cash reserves rather than equity issuance, the transaction expanded the enterprise’s total balance sheet holdings to 846,000 BTC. 

            The buy was Strategy’s first since 31 August and roughly an eighth the size of two days of ETF inflows. It was completed before the breakout, so it worked as a signal of confidence more than as a source of flow. The company has also sold bitcoin four times in the past four months.

            Bitcoin’s Key Price Levels to Monitor: The $82,000 Support Baseline

            Market structure now shifts toward validating newly established support zones. The $82,000 to $82,500 range, defined by the 4 September peak, capped price action throughout early September and now serves as the initial support floor. 

            A daily close back below $82,000 would return Bitcoin to the range it held through September and undo the breakout. With open interest still rising and the RSI near 70, a retest of that zone would show whether spot demand or leverage was carrying the move.

            Read more: Bitcoin (BTC) Weekly Price Analysis

            FAQs

            1. Why did Bitcoin hit its highest level since January?

            Bitcoin reached multi-month highs due to a simultaneous alignment of catalysts: $647.9 million in short liquidations, two consecutive days of spot ETF inflows totaling $592.5 million, and positive market sentiment following Strategy’s disclosure of a 950 BTC treasury purchase.

            2. How much bitcoin did Strategy buy?

            Strategy acquired 950 BTC for $75.7 million between 14 and 20 September at an average price of $79,670 per coin. Funded with cash reserves, this addition brought the company's total treasury holdings to 846,000 BTC.

            3. Are bitcoin ETF investors back in profit?

            Yes, on average. The rally above $85,000 lifted the market price above the estimated buys-only institutional cost basis of roughly $81,700, returning the average holder base to unrealized profit despite net annual outflows of approximately $1.45 billion in 2026.

            4. Which support level are Bitcoin traders watching?

            Traders are watching the $82,000 to $82,500 range, which previously acted as the September resistance ceiling. Secondary support sits at the ETF breakeven zone near $81,700, followed by the psychological $80,000 level.

            Trade Crypto in INR

            India’s Most Trusted Crypto Exchange

            Install Now!

            Share:
            All Blogs
            Trade Crypto in INR

            India’s Most Trusted Crypto Exchange

            Install Now!

            Recent Articles

            ZetaChain Is Moving ZETA to Solana: What Holders Need to Know

            Memes Lead as Dogecoin Breaks Its 200-Day Average on Rising Leverage

            Related posts

            ZetaChain Is Moving ZETA to Solana: What Holders Need to Know

            ZetaChain holders voted 99.4% to shut down the project’s own…


            Read more
            22 Sep 2026
              | 3 min read

            Memes Lead as Dogecoin Breaks Its 200-Day Average on Rising Leverage

            Dogecoin advanced roughly 22% over four consecutive trading sessions to…


            Read more
            22 Sep 2026
              | 3 min read
            coindcx-logo-india-ka-crypto-coach
            Company
            • About Us
            • Blog
            • Careers
            • Fees
            • Proof of Reserves
            • Partners
            • Bug Bounty
            • Community
            • Policy
            • C.I.P. Fund
            Product
            • Spot Trading
            • Margin Trading
            • Convert
            • Futures Trading
            • Earn
            • VIP
            Support
            • 24/7 Chat Support
            • Support Center
            • Terms of Use
            • Privacy Policy
            • Risk Disclosures
            • Security
            • Terms of Use: Web3 Wallet
            • Media Kit
            Business
            • OTC
            • API Broker
            • Enterprise
            • New Coin Listing
            • Ventures
            • Affiliate
            Buy Cryptos
            • Buy Bitcoin
            • Buy Ethereum
            • Buy Solana
            • Buy Ripple
            • Buy Dogecoin
            • Buy Shiba Inu
            • Buy Pepecoin
            Price Prediction
            • Bitcoin Price Prediction
            • Ethereum Price Prediction
            • Ripple Price Prediction
            • Dogecoin Price Prediction
            • Solana Price Prediction
            • Litecoin Price Prediction
            • All Price Predictions
            Contact Us

            Press Enquiries write to [email protected]
            Regulatory Issues/Enforcement Authorities: [email protected]
            For Grievance Redressal, Click here to know more.

            Disclaimer

            Crypto products & NFTs are unregulated and can be highly risky. There may be no regulatory recourse for any loss from such transactions. The information and material contained herein are subject to change without prior notice including prices which may fluctuate based on market demand and supply. The material available on the site is proprietary to CoinDCX, its parent, Licensor and/or its affiliates and is for informational purposes and informed investors only. This material is not: (i) an offer, or solicitation of an offer, to invest in, or to buy or sell, any interests or shares, or to participate in any investment or trading strategy, or (ii) intended to provide accounting, legal, or tax advice, or investment recommendations.

            *Internal CoinDCX Data as on 6th May 2025
            *Quarterly trading volume for Q4 FY’24-25. Currency conversion rate applied as in data capturing period
            *FIU Registered entity, NEBLIO TECHNOLOGIES PVT LTD
            *Certified in India for May 2023-24

            © 2024 All rights reserved

            Visit CoinDCX
                      No results See all results
                        Download App